
Polkadot (DOT) price is showing bearish signs below the $8 resistance against the US Dollar. The price could extend its decline if it fails to stay above $6.00.
- DOT is gaining pace below the $8.80 and $8.00 levels against the US Dollar.
- The price is trading below the $7.20 zone and the 100 simple moving average (4 hours).
- There is a key bearish trend line forming with resistance at $6.50 on the 4-hour chart of the DOT/USD pair (data source from Kraken).
- The pair could continue to decline toward the $5.00 support zone.
Polkadot Price Resumes Drop
After a steady increase, DOT price faced resistance near the $7.60 zone. It formed a short-term top and started a fresh decline below the $7.00 level, like Ethereum and Bitcoin.
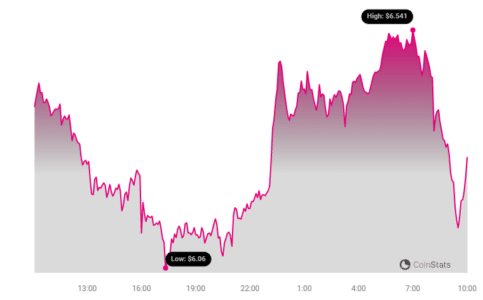
There was a move below the $6.20 support zone. A low was formed near $6.03 and the price is now consolidating losses. It is slowly moving higher above the $6.35 level and the 23.6% Fib retracement level of the downward move from the $7.58 swing high to the $6.03 low.
See Also: Shiba Inu’s Latest Price Projections – Here’s The Move You Should Make
DOT is now trading below the $7.00 zone and the 100 simple moving average (4 hours). Immediate resistance is near the $6.50 level. There is also a key bearish trend line forming with resistance at $6.50 on the 4-hour chart of the DOT/USD pair.
The next major resistance is near $7.00 or the 61.8% Fib retracement level of the downward move from the $7.58 swing high to the $6.03 low. A successful break above $7.00 could start another strong rally. In the stated case, the price could easily rally toward $8.20 in the near term. The next major resistance is seen near the $10.00 zone.
More Downsides in DOT?
If DOT price fails to start a fresh increase above $7.00, it could continue to move down. The first key support is near the $6.00 level.
The next major support is near the $5.65 level, below which the price might decline to $5.00. Any more losses may perhaps open the doors for a move toward the $4.20 support zone or the trend line.
Technical Indicators
- 4-Hours MACD – The MACD for DOT/USD is now losing momentum in the bearish zone.
- 4-Hours RSI (Relative Strength Index) – The RSI for DOT/USD is now below the 50 level.
- Major Support Levels – $6.00, $5.65 and $5.00.
- Major Resistance Levels – $6.50, $7.00, and $8.50
Disclaimer: The information provided is not trading advice. Bitcoinworld.co.in holds no liability for any investments made based on the information provided on this page. We strongly recommend independent research and/or consultation with a qualified professional before making any investment decisions.
#Binance #WRITE2EARN