
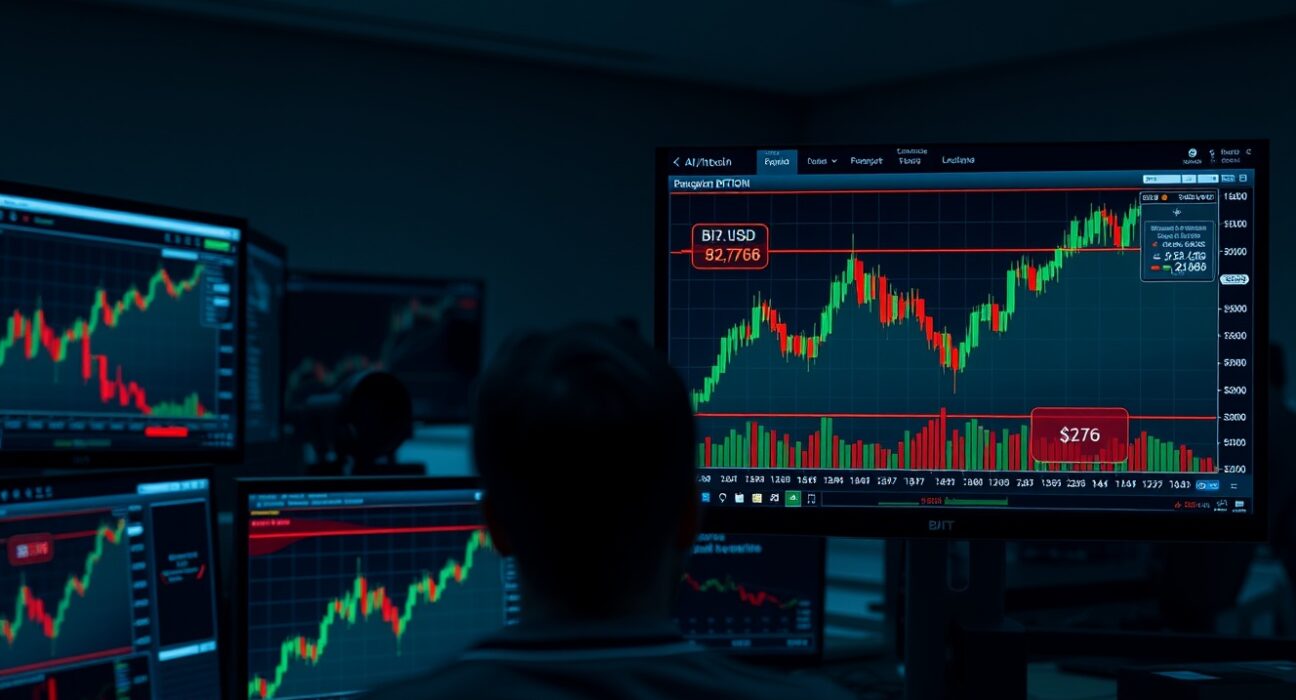
Bitcoin’s price trajectory is approaching a critical threshold that could trigger a significant cascade of liquidations across major cryptocurrency exchanges. According to data from CoinGlass, a market analytics platform, a BTC price increase to $82,766 would lead to the forced closure of approximately $858.8 million in short positions. Conversely, a decline below the $80,300 support level could result in the liquidation of roughly $402 million in long positions.
Understanding the Liquidation Dynamics
Liquidations occur when leveraged trading positions are forcibly closed by an exchange due to insufficient margin. The data compiled by CoinGlass aggregates open interest and liquidation levels across major centralized exchanges, providing a real-time snapshot of market vulnerability. The current figures highlight a pronounced asymmetry: the potential short-squeeze scenario involves more than double the capital at risk compared to a long-side liquidation event.
This imbalance suggests that market sentiment has been leaning bearish, with a higher concentration of traders betting on a price decline. A move to $82,766 would force these bearish positions to close, potentially accelerating upward price momentum as short sellers are compelled to buy back BTC to cover their positions.
Market Context and Implications
These liquidation levels come at a time of heightened volatility in the cryptocurrency market. Bitcoin has been testing key resistance zones, and the concentration of liquidity at specific price points often acts as a magnet for price action. Traders and analysts closely monitor such data to anticipate potential ‘squeeze’ events, which can amplify price movements beyond typical technical or fundamental drivers.
The $80,300 level is equally significant. A breakdown below this support could trigger a wave of long liquidations, adding downward pressure. This creates a two-sided risk environment where the market is primed for a sharp directional move depending on which level breaks first.
Why This Matters for Traders
For active market participants, understanding liquidation clusters provides a tactical advantage. These zones represent areas of potential price acceleration. A break above $82,766 could see a rapid spike as shorts are squeezed, while a drop below $80,300 might lead to a swift decline. The data serves as a risk management tool, helping traders set stop-losses and identify entry or exit points with greater precision.
Conclusion
The CoinGlass data underscores a pivotal moment for Bitcoin’s short-term price direction. With $860 million in short positions vulnerable to a rally and $402 million in longs at risk on a decline, the market is set for a potentially decisive move. While liquidation data is not a predictive indicator, it reveals the structural leverage in the system and the price levels that could act as catalysts for significant volatility. Traders should remain cautious and monitor these thresholds closely.
FAQs
Q1: What is a liquidation in cryptocurrency trading?
A liquidation occurs when a trader’s leveraged position is forcibly closed by the exchange because the margin balance falls below the required maintenance level, often due to adverse price movements.
Q2: How does CoinGlass calculate liquidation data?
CoinGlass aggregates open interest and liquidation levels from major centralized exchanges using their public APIs. The data reflects the cumulative value of positions that would be liquidated if the price reaches a specific level.
Q3: Can liquidation data predict Bitcoin’s price movement?
No. Liquidation data shows potential zones of price acceleration but does not predict direction. It is a risk analysis tool that highlights where concentrated leverage exists, which can amplify existing trends.
Disclaimer: The information provided is not trading advice, Bitcoinworld.co.in holds no liability for any investments made based on the information provided on this page. We strongly recommend independent research and/or consultation with a qualified professional before making any investment decisions.