

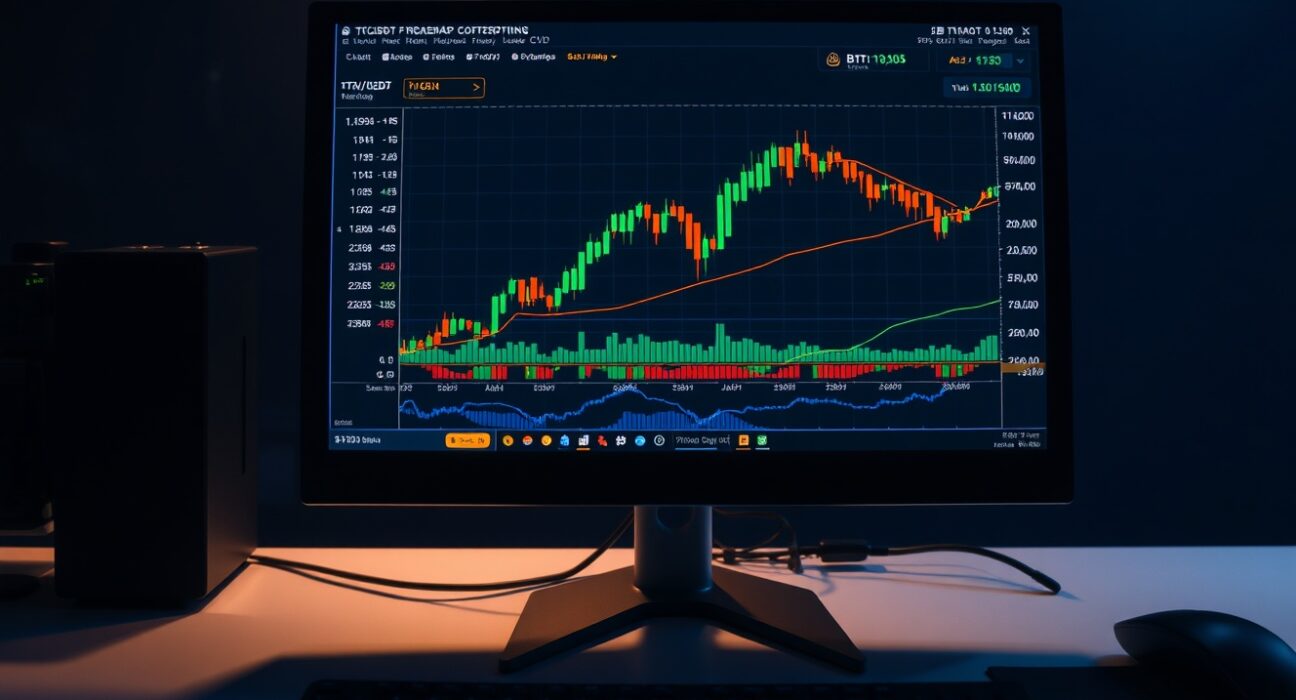
The Spot Cumulative Volume Delta (CVD) chart has become an essential tool for traders analyzing the BTC/USDT spot market. Unlike simple price charts, the CVD chart provides a deeper view into order book dynamics, helping traders identify where buying and selling pressure is concentrated. This guide breaks down its two core components: the Volume Heatmap and the Cumulative Volume Delta indicator.
Understanding the Volume Heatmap
The Volume Heatmap sits at the top of the Spot CVD chart and visually represents trading activity across different price levels. It tracks the volume of trades executed at each price point over a given period. The heatmap uses a color gradient where brighter or more intense colors indicate areas where the price has lingered or moved significantly. These bright zones often act as future support or resistance levels because they represent price levels where a large number of trades have occurred, creating a memory in the market. Traders watch these zones to anticipate potential price reactions.
Decoding the Cumulative Volume Delta (CVD)
The lower portion of the chart displays the Cumulative Volume Delta indicator, which tracks the net difference between buy and sell orders, categorized by trade size. This is where the chart becomes particularly useful for understanding order flow. The CVD line rises when buy orders outnumber sell orders for a specific trade size category, indicating aggressive buying. Conversely, a falling line suggests selling pressure is dominant.
Trade Size Categories and Their Significance
The CVD indicator typically plots multiple lines, each representing a different order size range. For example, the yellow line may track orders between $100 and $1,000, representing retail traders. The brown line could track large orders between $1 million and $10 million, often associated with institutional activity. By comparing these lines, traders can gauge whether retail or institutional players are driving the market. A divergence between the two — for instance, retail buying while institutions sell — can signal a potential trend reversal.
Why This Matters for Traders
The Spot CVD chart provides a layer of transparency often missing from standard price charts. For active traders, understanding where large orders are accumulating helps in setting entry and exit points. For longer-term holders, the heatmap can reveal key price levels that the market has historically respected. However, like all indicators, the CVD chart is not infallible and should be used in conjunction with other analysis tools, such as volume profiles and moving averages, to confirm signals.
Conclusion
The Spot CVD chart offers a practical way to visualize order book activity for BTC/USDT. By combining the Volume Heatmap’s visual cues with the CVD’s order flow data, traders can gain a clearer picture of market sentiment. As with any trading tool, practice and context are key — the chart is most effective when used as part of a broader analytical strategy.
FAQs
Q1: What does a bright area on the Volume Heatmap mean?
A bright area indicates high trading volume at that price level, often suggesting a zone where the price has consolidated or reversed. These levels frequently act as support or resistance in future price movements.
Q2: How is the Cumulative Volume Delta different from regular volume?
Regular volume shows the total number of trades. The CVD breaks volume down into buy and sell orders by size, showing the net directional pressure. This helps traders see whether large or small traders are driving the market.
Q3: Can the Spot CVD chart predict price movements?
No indicator can predict the market with certainty. The CVD chart is a diagnostic tool that reveals current order flow dynamics. It is most useful when combined with other forms of technical analysis and risk management.
Disclaimer: The information provided is not trading advice, Bitcoinworld.co.in holds no liability for any investments made based on the information provided on this page. We strongly recommend independent research and/or consultation with a qualified professional before making any investment decisions.
