
Cryptocurrency markets are known for their volatility, and Toncoin (TON) is no exception. Over the last 24 hours, TON has experienced a notable price correction, prompting investors and enthusiasts to wonder about the road ahead. Let’s dive into the recent price movements of Toncoin, analyze the key indicators, and explore what this could mean for the future of TON.
Toncoin (TON) Price Overview: Recent Performance
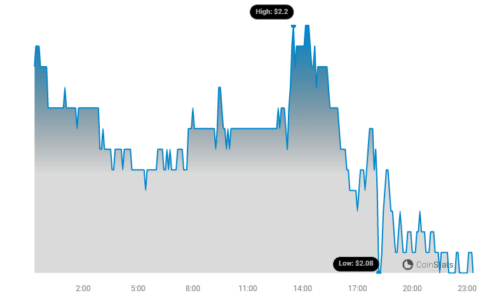
As of today, Toncoin (TON) is trading at $2.09. This represents a 3.16% decrease in price over the past 24 hours. While a daily dip isn’t always cause for alarm in the crypto world, it’s important to understand the broader trend.
Looking at the bigger picture, the downward pressure on TON’s price isn’t just a one-day event. Over the past week, Toncoin has seen a consistent negative trend, with an overall 8.0% loss. The price has moved from $2.28 last week to its current level, indicating a sustained period of selling pressure or market correction.
Decoding Volatility: Bollinger Bands and TON Price Swings
To better understand the dynamics of TON’s price movement, let’s consider volatility. Volatility in crypto markets refers to the degree of price fluctuation over time. Higher volatility means prices can swing dramatically, while lower volatility indicates more stable price action.
One useful tool for visualizing volatility is Bollinger Bands. These bands, represented by the gray areas in the charts below, measure the standard deviation of price movements.
- Wider Bands = Higher Volatility: When Bollinger Bands widen, it signifies increased price volatility. This means that the price of TON has been fluctuating more significantly during that period.
- Narrower Bands = Lower Volatility: Conversely, narrower bands suggest lower volatility, indicating a period of relative price stability.
The chart below provides a visual comparison of TON’s price movement and volatility over two different timeframes:
- Left Chart (24 Hours): Shows the daily price movement and volatility.
- Right Chart (Past Week): Illustrates the weekly price trend and volatility.
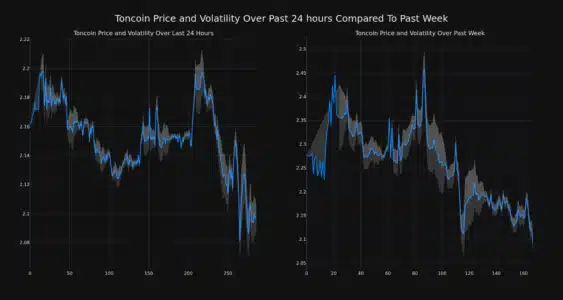
By observing the width of the Bollinger Bands in both charts, we can gauge whether TON has experienced higher or lower volatility in the short term (daily) versus the medium term (weekly).
See Also: The Price Of Aptos (APT) Increased More Than 24% Within 24 Hours
Trading Volume and Circulating Supply: What are the Indicators Saying?
Beyond price and volatility, other key metrics can provide insights into the health and momentum of Toncoin. Let’s examine trading volume and circulating supply.
- Trading Volume: This represents the total amount of TON coins traded within a specific period. A decrease in trading volume can sometimes indicate waning interest or reduced market activity.
- Circulating Supply: This refers to the number of TON coins currently in circulation and available for trading. An increase in circulating supply can, under certain circumstances, exert downward pressure on price if demand doesn’t keep pace.
In the case of Toncoin, the trading volume has decreased by 5.0% over the past week. Interestingly, this is happening while the circulating supply of TON has increased by 0.69% over the same period.
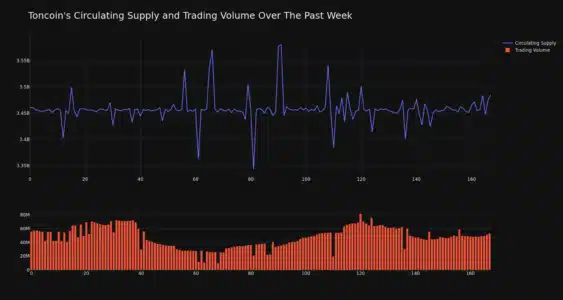
Currently, the circulating supply of TON stands at 3.46 billion coins. According to market data, Toncoin holds a market cap ranking of #16, with a market capitalization of $7.25 billion.
Key Takeaways and Market Outlook for TON
To summarize the current situation with Toncoin (TON):
- Price Decline: TON has experienced a 3.16% price drop in the last 24 hours and an 8.0% decrease over the past week.
- Volatility: Monitor the Bollinger Bands in the provided charts to assess short-term and medium-term volatility trends.
- Decreasing Trading Volume: Trading volume has decreased, which could indicate reduced market activity.
- Increasing Circulating Supply: The circulating supply has slightly increased, which could be a contributing factor to the recent price dip.
- Market Rank: Despite the recent downturn, TON remains a significant cryptocurrency, holding the #16 market cap ranking.
What’s Next for Toncoin?
Predicting the future of cryptocurrency prices is inherently challenging. However, understanding the current market dynamics and key indicators can help you make informed decisions. The recent price correction in Toncoin could present a potential buying opportunity for some, while others may see it as a signal to remain cautious.
Before making any investment decisions, it’s crucial to conduct your own thorough research and consider your risk tolerance. Keep an eye on broader market trends, developments within the TON ecosystem, and further price action to get a clearer picture of where Toncoin might be headed.
Disclaimer: The information provided is not trading advice. Bitcoinworld.co.in holds no liability for any investments made based on the information provided on this page. We strongly recommend independent research and/or consultation with a qualified professional before making any investment decisions.
Disclaimer: The information provided is not trading advice, Bitcoinworld.co.in holds no liability for any investments made based on the information provided on this page. We strongly recommend independent research and/or consultation with a qualified professional before making any investment decisions.
