
Hold onto your hats, crypto enthusiasts! Polygon (MATIC), the Layer-2 scaling solution for Ethereum, is making waves in the market once again. If you’ve been keeping an eye on your portfolio, you might have noticed a welcome surge of green. Over the past 24 hours, Polygon’s price has jumped by a solid 3.07%, pushing it to around $0.87. But what’s fueling this upward momentum, and is it just a fleeting blip or the start of a more sustained rally? Let’s dive deep into the latest Polygon (MATIC) price analysis to understand what’s happening and what it could mean for your crypto investments.
 MATIC Price Chart | Source: Coinstats
[/caption>
MATIC’s Recent Price Action: A Closer Look
The crypto market is known for its volatility, and Polygon is no exception. However, recent trends paint a positive picture for MATIC holders. Let’s break down the key highlights:
- 24-Hour Surge: As we mentioned, MATIC has seen a 3.07% increase in price over the last 24 hours. This is a significant move, especially in a market that can often be unpredictable.
- Weekly Uptick: Zooming out to a weekly view, the gains are even more impressive. Polygon has experienced a robust 12.0% price increase in the past week alone! This upward trajectory has propelled MATIC from around $0.78 to its current price point.
- Distance from All-Time High: While these recent gains are encouraging, it’s worth remembering that MATIC still has room to grow to reach its all-time high of $2.92. This peak price point serves as a reminder of MATIC’s potential and the heights it has achieved in the past.
See Also: Price Analysis: Toncoin (TON) Price Increased More Than 5% In 24 Hours
Decoding the Charts: Price Movement and Volatility
To truly understand MATIC’s price action, we need to delve into the charts. Visualizing price movements and volatility can provide valuable insights into market dynamics. The chart below gives us a comparative view:
 MATIC Price and Volatility Chart
[/caption>
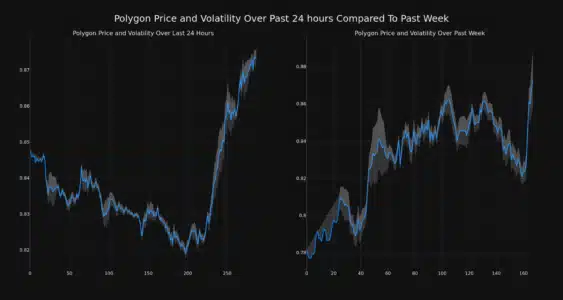
This chart compares Polygon’s price movement and volatility over two key periods:
- Past 24 Hours (Left Chart): This gives us a granular view of the recent price surge and the associated volatility within a single day.
- Past Week (Right Chart): This broader perspective helps us understand the overall trend and how volatility has played out over the week’s price movements.
Bollinger Bands: Your Volatility Meter
Notice the gray bands in the charts? These are Bollinger Bands, a popular technical analysis tool used to measure market volatility. Think of them as dynamic volatility indicators. Here’s how to interpret them:
- Width Matters: The width of the Bollinger Bands, represented by the gray area, directly reflects the level of volatility.
- Wider Bands = Higher Volatility: When the bands widen, it signifies increased price fluctuations and higher volatility. Conversely, narrower bands suggest lower volatility and more stable price movements.
By observing the Bollinger Bands on the MATIC charts, we can gauge whether the recent price increase is accompanied by high or moderate volatility. This can help us assess the strength and potential sustainability of the price trend.
Trading Volume and Circulating Supply: Key Indicators
Price movements are just one piece of the puzzle. To get a more holistic view of MATIC’s market health, we need to consider trading volume and circulating supply. These metrics can offer clues about market interest and tokenomics.
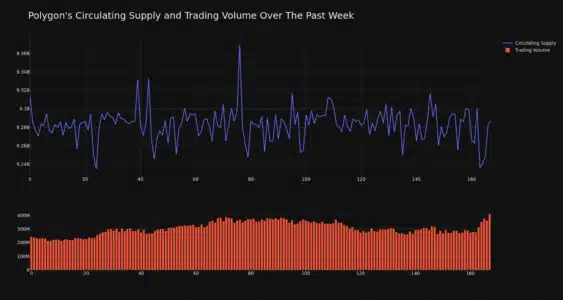 MATC Circulating Supply and Trading Volume
[/caption>
Let’s analyze the trends in these crucial indicators:
- Trading Volume Surge: Here’s another bullish signal – MATIC’s trading volume has skyrocketed by an impressive 69.0% over the past week! This significant increase indicates heightened market activity and growing interest in trading MATIC. A surge in trading volume often accompanies and supports price increases, suggesting stronger market conviction.
- Circulating Supply Slight Decrease: Interestingly, while trading volume surged, the circulating supply of MATIC has slightly decreased by 0.3% over the same week. While seemingly small, a decrease in circulating supply, coupled with increased demand (indicated by price and volume), can be a positive sign for price appreciation. It suggests that tokens are being held rather than actively traded, potentially creating scarcity.
Current Supply Dynamics
Currently, the circulating supply of MATIC is estimated to be around 92.83% of its maximum supply, which is capped at 10.00 billion tokens. This means that the vast majority of MATIC tokens are already in circulation. Understanding the supply dynamics is crucial for long-term price predictions, as scarcity can play a significant role in value appreciation.
Market Cap and Ranking: Where Does MATIC Stand?
Market capitalization (market cap) is a crucial metric for assessing the overall size and dominance of a cryptocurrency. It’s calculated by multiplying the current price of a cryptocurrency by its circulating supply. A higher market cap generally indicates a more established and potentially less volatile cryptocurrency (though this is not always the case!).
As of now, Polygon (MATIC) holds the #15 position in the cryptocurrency market cap rankings, with a market cap of approximately $8.11 billion. Breaking into the top 15 is a significant achievement, placing MATIC among the leading cryptocurrencies in the market. This ranking reflects the market’s confidence in Polygon’s technology, adoption, and future potential.
Is the MATIC Rally Sustainable? Looking Ahead
While the recent price surge and positive market indicators are encouraging for Polygon (MATIC), the crypto market is inherently volatile. It’s crucial to approach any investment with caution and conduct thorough research. Here are some factors to consider when assessing the sustainability of the current MATIC rally:
- Broader Market Sentiment: MATIC’s price is influenced by the overall sentiment of the cryptocurrency market. Positive trends in Bitcoin and Ethereum often have a ripple effect on altcoins like MATIC.
- Polygon Network Developments: Keep an eye on developments within the Polygon ecosystem. New partnerships, technological upgrades, and increased adoption of Polygon’s scaling solutions can positively impact its price.
- Competition: The Layer-2 scaling solution space is competitive. Monitor how Polygon fares against its rivals and whether it maintains its competitive edge.
- Profit-Taking: After a significant price surge, some investors may choose to take profits, which could lead to a temporary price correction.
Actionable Insights for Investors
- Stay Informed: Continuously monitor market trends, news related to Polygon, and broader crypto market developments.
- Diversification: Never put all your eggs in one basket. Diversify your crypto portfolio to mitigate risk.
- Risk Management: Understand your risk tolerance and invest accordingly. Never invest more than you can afford to lose.
- Due Diligence: Conduct your own independent research and consider consulting with a financial advisor before making any investment decisions.
Disclaimer: The information provided is not trading nor financial advice. Bitcoinworld.co.in holds no liability for any trading or investments made based on the information provided on this page. We strongly recommend independent research and/or consultation with a qualified professional before making any trading or investment decisions.
In Conclusion: MATIC’s Positive Momentum and Cautious Optimism
Polygon (MATIC) is currently enjoying a period of positive price momentum, fueled by increased trading volume and a healthy market cap ranking. The 3% surge in the last 24 hours and the impressive 12% weekly gain are certainly noteworthy. However, like all cryptocurrencies, MATIC’s price is subject to market volatility and external factors. While the current trends are encouraging, a balanced and informed approach to investing is always recommended. Keep a close watch on market dynamics, network developments, and always prioritize responsible investing practices. Is the rally sustainable? Only time will tell, but for now, Polygon (MATIC) is definitely a cryptocurrency to watch closely.
#Binance #WRITE2EARN
Disclaimer: The information provided is not trading advice, Bitcoinworld.co.in holds no liability for any investments made based on the information provided on this page. We strongly recommend independent research and/or consultation with a qualified professional before making any investment decisions.
