
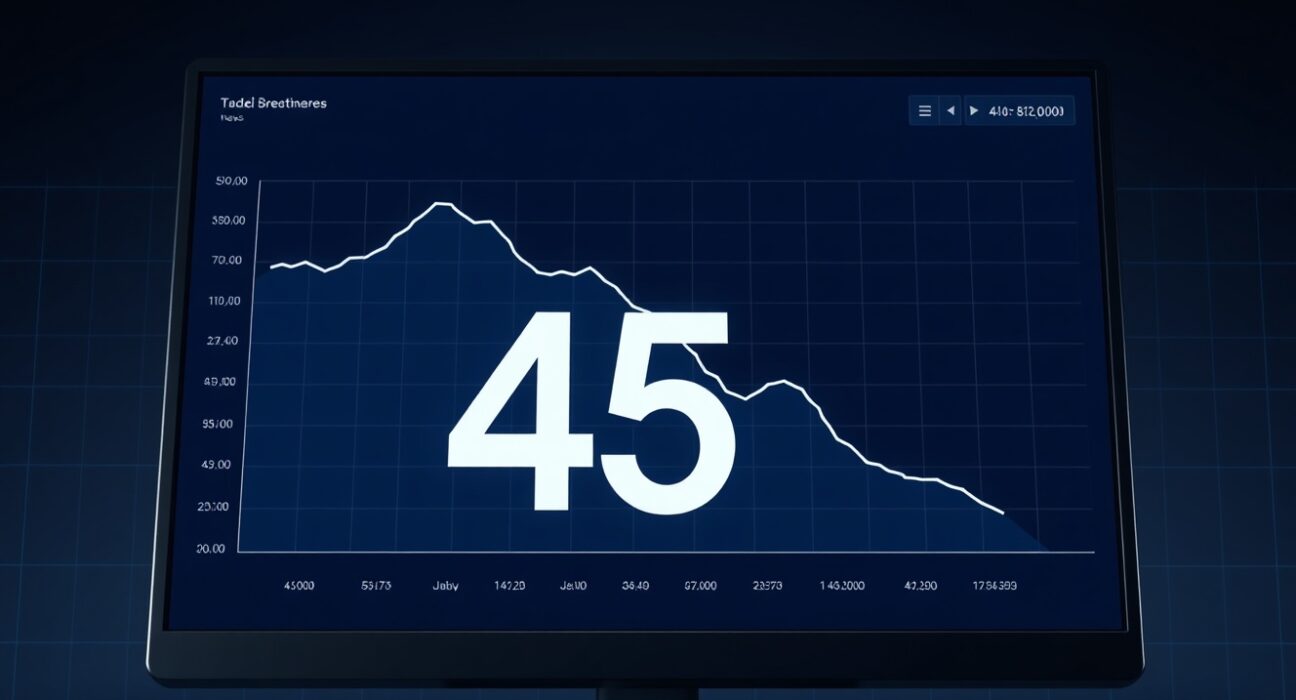
The cryptocurrency market’s internal barometer flashed a notable signal this week as the widely watched Altcoin Season Index from CoinMarketCap declined to a score of 45. This four-point drop from the previous day’s reading provides a crucial, data-driven snapshot of current market structure, strongly suggesting a period of Bitcoin dominance is underway. Market participants and analysts closely monitor this metric for clues about capital rotation and broader investor sentiment across the digital asset ecosystem.
Decoding the Altcoin Season Index Drop to 45
CoinMarketCap’s Altcoin Season Index serves as a quantitative gauge for market cycles. The platform calculates this figure by comparing the 90-day performance of the top 100 cryptocurrencies, excluding stablecoins and wrapped assets, against Bitcoin’s performance over the same period. Consequently, a score approaching 100 indicates that a majority of these altcoins are outperforming Bitcoin, a condition formally declared as an ‘altcoin season’ when 75% of them beat Bitcoin’s returns. Conversely, a score of 45, as observed currently, firmly places the market in ‘Bitcoin season’ territory. This shift underscores a consolidation of investor confidence and capital into the market’s largest and most established asset.
Historically, these transitions between Bitcoin and altcoin seasons are not abrupt. They often develop over weeks, reflecting gradual changes in risk appetite. For instance, the index hovered near 30 for extended periods during the prolonged crypto winter of 2022. The current reading of 45, therefore, represents a middle ground. It is far from the exuberant highs of a full altcoin season but also significantly above the depths of extreme Bitcoin dominance. This positioning suggests a cautious, watchful market where Bitcoin leads, but selective altcoins may still attract attention based on fundamental developments.
The Mechanics of Market Cycle Measurement
Understanding the index requires a grasp of its underlying mechanics. The calculation is deliberately designed to filter out noise. By excluding stablecoins—whose prices are pegged to fiat currencies—and wrapped tokens—which represent Bitcoin on other blockchains—the index focuses purely on speculative assets competing for investment. The 90-day window is also strategic. It is long enough to smooth out short-term volatility and hype-driven pumps, yet short enough to capture meaningful medium-term trends. This methodology provides a more reliable signal than daily or weekly price swings.
Several key factors typically influence the index’s movement:
- Bitcoin ETF Flows: Significant inflows or outflows from U.S. spot Bitcoin ETFs can disproportionately boost BTC’s price and market dominance.
- Macroeconomic Conditions: Rising interest rates or risk-off sentiment in traditional markets often cause capital to flee to the perceived safety of Bitcoin over smaller altcoins.
- Network Activity: Periods of high transaction fees or congestion on the Bitcoin network can sometimes drive interest toward alternative layer-1 blockchains.
- Regulatory News: Clarity or uncertainty regarding regulations, particularly for assets deemed securities, can impact altcoin cohorts differently than Bitcoin.
Historical Context and Expert Analysis
Data from previous cycles offers essential context. For example, during the bull market of late 2020 into early 2021, the Altcoin Season Index repeatedly breached the 75 threshold, leading to legendary rallies for assets like Ethereum, Chainlink, and Polygon. In contrast, the bear market of 2022 saw the index consistently below 25, with Bitcoin often being the least-worst performer. The current level of 45 fits a historical pattern often observed in the early or maturing phases of a Bitcoin-led rally, where capital begins to accumulate in BTC before potentially rotating outwards.
Market analysts emphasize that the index is a lagging indicator, confirming a trend already in motion. “A drop to 45 doesn’t predict the future, but it clearly describes the present,” notes a report from a major crypto research firm. “It tells us that over the last quarter, Bitcoin has been the preferred vehicle. The critical question for traders is whether this trend will persist or if we are approaching an inflection point.” This analytical perspective reinforces the index’s role as a diagnostic tool rather than a crystal ball.
Implications for Investors and the Broader Ecosystem
The immediate implication of a 45 reading is a market environment favoring Bitcoin-centric strategies. This might include direct BTC accumulation, investments in Bitcoin-related equities, or strategies tied to Bitcoin’s network hash rate. For altcoin projects, a low index score can pressure development teams to demonstrate tangible utility and adoption to attract capital in a competitive environment. It often separates projects with robust fundamentals from those reliant purely on market-wide speculation.
Furthermore, sector performance within the altcoin universe becomes more nuanced during such periods. While the broad index is low, specific sectors like decentralized finance (DeFi) blue-chips or privacy coins might show relative strength. Savvy investors often use the Altcoin Season Index as a macro filter, then drill down into sector-specific metrics to identify potential outliers. This two-layer analysis is crucial for navigating a Bitcoin-dominant market phase effectively.
Conclusion
The decline of the Altcoin Season Index to 45 offers a clear, data-centric narrative for the current cryptocurrency landscape. It signals a definitive phase of Bitcoin strength, compelling market participants to adjust their strategies and expectations accordingly. While not predictive of an endless Bitcoin rally, this metric provides vital confirmation of the prevailing market structure. Monitoring its future trajectory, especially for a sustained move above or further decline below this level, will be essential for understanding the next major rotation of capital within the dynamic digital asset market.
FAQs
Q1: What does an Altcoin Season Index score of 45 mean?
An index score of 45 means that less than 75% of the top 100 altcoins have outperformed Bitcoin over the past 90 days. This officially indicates a ‘Bitcoin season,’ where BTC is the dominant performer in the market.
Q2: How is the Altcoin Season Index calculated?
CoinMarketCap calculates the index by comparing the 90-day price performance of the top 100 cryptocurrencies (excluding stablecoins and wrapped tokens) against Bitcoin’s performance. A season is declared if 75% of them outperform BTC.
Q3: Is a low Altcoin Season Index bad for the crypto market?
Not necessarily. It indicates a phase of market consolidation and risk assessment, often with capital flowing into Bitcoin. These phases are a normal part of crypto market cycles and can establish a stronger foundation for future broad-based rallies.
Q4: Can the index predict when altcoin season will start?
The index is a lagging indicator, confirming a trend already in progress. A sustained rise above 50, and particularly a rapid climb toward 75, can signal the early stages of capital rotating from Bitcoin into altcoins.
Q5: Where can I track the Altcoin Season Index?
The primary source is the CoinMarketCap website, typically found within its market data or research sections. Several other crypto analytics platforms also track and visualize similar metrics based on the same methodology.
Disclaimer: The information provided is not trading advice, Bitcoinworld.co.in holds no liability for any investments made based on the information provided on this page. We strongly recommend independent research and/or consultation with a qualified professional before making any investment decisions.
