
Bitcoin is back in the spotlight, surging to $30,000 and injecting fresh energy into the crypto market. Are you wondering if this rally is here to stay, and more importantly, how altcoins like Solana (SOL), Chainlink (LINK), Aave, and Stacks (STX) are reacting? Let’s dive into the charts and analyze what’s happening and what could be next for these popular cryptocurrencies.
Bitcoin at $30K: Bull Run or Temporary Peak?
Bitcoin (BTC) has had an impressive week, climbing around 10% to reach the significant $30,000 mark. This surge has investors asking the big question: Is this the start of a sustained bull run, or are we looking at a temporary peak before a potential pullback?
Analysts at Stockmoney Lizards suggest Bitcoin might be on the verge of breaking through a major resistance level. They believe that the potential approval of a Bitcoin ETF could drive wider adoption and fuel this rally, especially with the Bitcoin halving event on the horizon in April 2024.
This positive momentum isn’t just limited to Bitcoin. We’ve seen a ripple effect across the altcoin market, with many cryptocurrencies breaking above their own resistance levels. The overall sentiment is shifting towards optimism, leading many to consider strategic investments. Historically, leading coins in a market surge tend to outperform, while those lagging behind might be best observed for now.
Let’s examine the price charts of five cryptocurrencies showing strong potential in the near term:
Bitcoin (BTC) Price Analysis
Bitcoin is currently battling it out around the $30,000 level. There’s a tug-of-war between buyers and sellers, but buyers seem reluctant to give up ground. This consolidation suggests they are gearing up for another push higher, potentially targeting the $31,000 to $32,400 resistance zone.
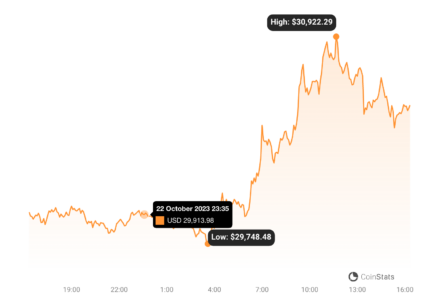
However, if Bitcoin’s price retreats from the $31,000 area, we could see a dip towards the 20-day exponential moving average (EMA) at $28,160. If the price bounces back from this EMA, it would signal continued buying interest and another attempt to break through the overhead resistance.
A break below the 20-day EMA, on the other hand, could dampen the bullish outlook. This might trap Bitcoin within a range of $31,000 to $24,800 for a while.
Looking at the 4-hour chart, we often see traders buying dips at the 20-EMA during an uptrend, reflecting bullish sentiment. If this pattern continues, it strengthens the case for a move towards $32,400.
Conversely, a drop below the 20-EMA on the 4-hour chart might indicate sellers are taking profits, potentially leading to a deeper correction towards the $28,143 support level.
Key Bitcoin Levels to Watch:
- Resistance Zone: $31,000 – $32,400
- 20-day EMA Support: $28,160
- Critical Support: $28,143
Solana (SOL) Price Analysis
Solana (SOL) broke out decisively on October 19th, completing a bullish inverse head and shoulders pattern. This pattern suggests a potential target of $32.81. However, the Relative Strength Index (RSI) is currently in overbought territory, indicating a possible short-term pullback.
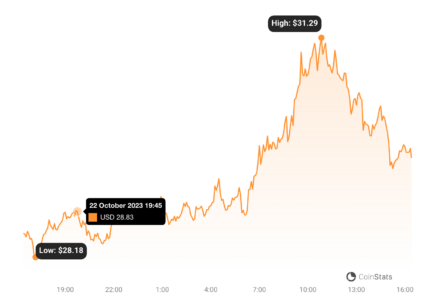
The crucial support level for Solana is at $27.12. A strong bounce from this level would confirm it as new support, reinforcing the bullish momentum. If Solana pushes beyond $32.81, the next target could be $39.
For sellers to regain control, they need to quickly push the price below $27.12. This would suggest the breakout above $27.12 might have been a false signal, making this level critical to watch.
On the 4-hour chart, Solana is facing resistance around $30. This could trigger a retracement back to the $27.12 breakout level. Buyers are likely to defend this level strongly. A strong rebound here would signal continued bullishness.
However, if the price breaks below $27.12, it would indicate strong selling pressure at higher levels, potentially leading to a drop towards the neckline of the inverse head and shoulders pattern around $24.50.
Key Solana Levels to Watch:
- Pattern Target: $32.81
- Critical Support: $27.12
- Neckline Support (if breakdown): ~$24.50
Chainlink (LINK) Price Analysis
Chainlink (LINK) has been trading within a tight range between $5.50 and $9.50 since May 2022, indicating a balance between buying and selling pressure.
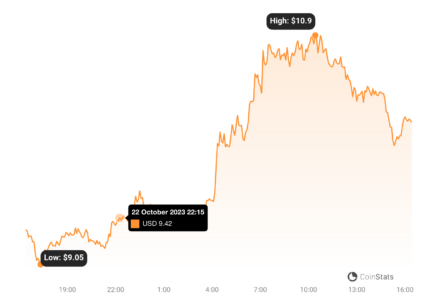
Buyers attempted to break out above this range on October 22nd, but a long upper wick on the candlestick shows sellers are still active at higher levels. If buyers can maintain the price at current levels, it increases the chances of a breakout above $9.50.
In that case, Chainlink could rally towards a pattern target of $13.50. Breakouts from long consolidation periods can lead to rapid price increases, potentially extending the uptrend to $15 and then $18.
The immediate support on the downside is at $8.50. A break below this level would suggest the range-bound trading might continue for longer.
The 4-hour chart shows a strong rally from $7.50, pushing the RSI into overbought territory. This suggests a possible short-term pullback or consolidation.
Key support levels on the 4-hour chart are $8.75 and $8.50. A strong bounce from this zone would indicate continued positive sentiment and a retest of $9.75 is likely.
However, a break below the 20-EMA on the 4-hour chart would signal renewed selling pressure, potentially pushing the price down to $7.
Key Chainlink Levels to Watch:
- Range Resistance: $9.50
- Pattern Target (if breakout): $13.50
- Support Levels: $8.75, $8.50, $7
Aave Price Analysis
Aave broke out on October 21st, moving above a bearish descending triangle pattern. When bearish patterns fail, it often opens the door for bullish moves.
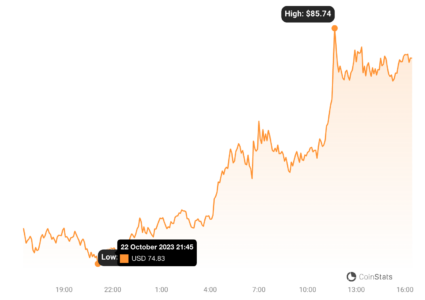
Both moving averages are turning upwards, and the RSI is firmly in overbought territory, indicating buyers are in control. As long as the price stays above the descending trendline, Aave could potentially reach $88, with a further target of $95.
To counter this bullish momentum, sellers need to quickly push the price back below the descending trendline. This could surprise some buyers and trigger a correction towards the moving averages. If the price falls below the 50-day simple moving average (SMA) at $62, sellers might regain control.
Looking at the 4-hour chart, sellers attempted to halt the rally at the descending trendline, but buyers defended it, and momentum picked up. The price is now moving towards $88.
In the short term, the overbought RSI suggests possible consolidation or a pullback. If a retracement occurs, the first support level is around $72. If sellers manage to push the price below the descending trendline, it could trigger further selling, potentially leading back to the moving averages. A break below the 50-day SMA at $62 would strengthen the bearish case.
Key Aave Levels to Watch:
- Upside Targets: $88, $95
- Descending Trendline Support: (Check current chart)
- 50-day SMA Support: $62
- Short-term Support: $72
Stacks (STX) Price Analysis
Stacks (STX) has seen a sharp upturn recently, indicating buyers are trying to initiate a new uptrend.
The bullish crossover of moving averages suggests buyers currently have the upper hand. However, the RSI is overbought in the short term, suggesting a possible minor correction or consolidation. The initial support level is the 20-day EMA, currently around $0.54.
If the price bounces from the 20-day EMA, it would signal a shift in sentiment towards buying on dips, increasing the likelihood of continued upward momentum. STX could initially target $0.80, with a further aim of $0.90.
However, this bullish outlook could be challenged if the price reverses and breaks below the 20-day EMA.
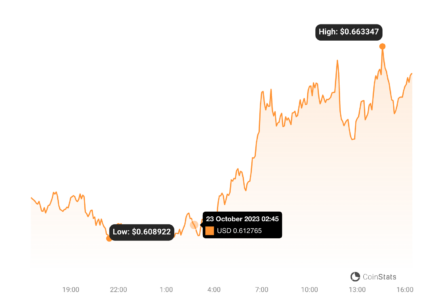
The 4-hour chart shows a tight consolidation between $0.61 and $0.65. This is a positive sign, suggesting buyers are holding their positions and anticipating further gains. If buyers can push the price above $0.65, a rally towards $0.68 and then $0.75 is possible.
Conversely, a reversal and a break below the 20-EMA on the 4-hour chart would signal profit-taking, potentially leading to a drop towards the 50-SMA. It’s important to watch these support and resistance levels for potential trading opportunities.
Key Stacks Levels to Watch:
- Upside Targets: $0.80, $0.90, $0.68, $0.75
- 20-day EMA Support: ~$0.54
- Consolidation Range: $0.61 – $0.65
- 50-SMA Support (if breakdown): (Check current chart)
In Conclusion: Crypto Market Dynamics Remain Fluid
The cryptocurrency market, as exemplified by Bitcoin, Solana, Chainlink, Aave, and Stacks, is in a constant state of flux. Buyers and sellers are continuously vying for control, creating a dynamic and sometimes unpredictable landscape. The direction these digital assets will ultimately take remains uncertain. Keep a close eye on the key levels discussed, and remember that market analysis is not financial advice. Always do your own research before making any investment decisions.
Disclaimer: The information provided is not trading advice, Bitcoinworld.co.in holds no liability for any investments made based on the information provided on this page. We strongly recommend independent research and/or consultation with a qualified professional before making any investment decisions.