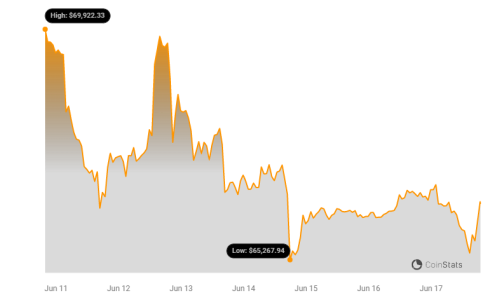
Bitcoin bulls are facing headwinds! After failing to break above the $67,000 resistance, Bitcoin’s price has resumed its downward trajectory. Is this a temporary setback or the start of a deeper correction? Let’s dive into the key levels and technical indicators to watch.
Bitcoin Price Resumes Decline
Bitcoin (BTC) struggled to maintain its upward momentum, facing strong resistance around the $67,000 mark. This failure to break higher led to a fresh decline, starting from a high of $66,868. The price subsequently dipped below the $66,500 level, signaling further weakness.

Adding to the bearish sentiment, a connecting bullish trend line with support at $66,500 on the hourly chart of the BTC/USD pair was breached. The pair also traded below the 23.6% Fibonacci retracement level of the recent upward move, further confirming the downward pressure.
Currently, Bitcoin is trading below $66,800 and the 100-hour simple moving average (SMA), suggesting a potential test of the 50% Fibonacci retracement level. Here’s a breakdown of what to watch:
- Key Resistance: $66,500 and the 100 hourly SMA.
- Immediate Resistance: $66,850.
- Major Resistance: $67,000. A break above this level could signal a bullish reversal.
If Bitcoin manages to overcome the $67,000 resistance, we could see a significant upward move, potentially targeting the $68,000 and then $68,500 levels in the near term.
More Losses In BTC?
The bears aren’t giving up yet! If Bitcoin fails to breach the $66,500 resistance zone, expect further downside. Here are the key support levels to keep an eye on:
- Immediate Support: $66,000.
- First Major Support: $65,750.
- Next Support: $65,500. A break below this level could trigger a sharper decline towards the $65,000 support zone.
Technical Indicators Pointing Downward
Technical indicators are currently leaning bearish, reinforcing the possibility of further price declines. Let’s take a look:
- Hourly MACD: The MACD is gaining momentum in the bearish zone, signaling increasing selling pressure.
- Hourly RSI (Relative Strength Index): The RSI for BTC/USD is below the 50 level, indicating that sellers have more control.
- Major Support Levels: $66,500, followed by $65,000.
- Major Resistance Levels: $66,500, and $67,000.
Actionable Insights
- Monitor Key Levels: Keep a close watch on the $66,500 resistance and the $65,500 support.
- Manage Risk: If you’re in a long position, consider setting stop-loss orders to protect your capital.
- Stay Informed: Keep an eye on technical indicators and market news for potential shifts in momentum.
Disclaimer: The information provided is not trading advice. Bitcoinworld.co.in holds no liability for any investments made based on the information provided on this page. We strongly recommend independent research and/or consultation with a qualified professional before making any investment decisions.
Disclaimer: The information provided is not trading advice, Bitcoinworld.co.in holds no liability for any investments made based on the information provided on this page. We strongly recommend independent research and/or consultation with a qualified professional before making any investment decisions.


