

Bitcoin is making headlines again! After a period of sideways movement, the king of crypto has sprung back to life, decisively breaking through the crucial $48,000 resistance level. But is this just a temporary pump, or are we witnessing the start of a sustained bull run towards the coveted $50,000 mark? Let’s dive into the charts and analyze what’s driving Bitcoin’s price action and what to expect next.
Bitcoin Price Surges Past $48K: What Ignited the Rally?
Bitcoin’s recent surge is a welcome sight for crypto enthusiasts. The price action has been undeniably positive, marked by a significant push above key resistance zones. Here’s a quick recap of the bullish momentum:
- BTC decisively broke above the $45,500 resistance zone, signaling strong buying pressure.
- The rally gained further strength as Bitcoin smashed through the $46,000 and $47,200 levels, converting previous resistance into support.
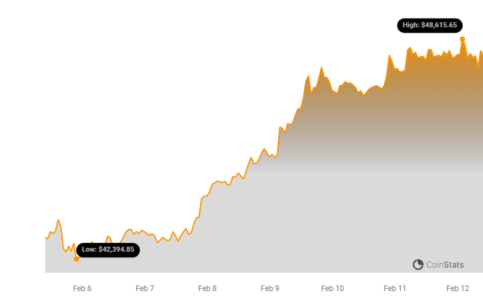
- Bulls successfully pumped the price beyond the critical $48,000 resistance, reaching a peak of $48,800.
- This surge marks a new multi-week high, hitting $48,775 before a period of consolidation.
Currently, Bitcoin is trading above $47,500 and comfortably above the 100-hourly Simple Moving Average, indicating continued bullish sentiment in the short term.
See Also: This Week in Coins: Bitcoin and Solana Jump, Rest of Crypto Market Rises
$50K in Sight? Analyzing Bitcoin’s Next Move
With Bitcoin reclaiming $48,000, the burning question is: can it reach $50,000? Technical analysis suggests a potential pathway, but also highlights crucial levels to watch.
- Bullish Trendline: A key bullish trendline is forming on the hourly chart, providing support around $48,000. This trendline needs to hold to maintain the upward momentum.
- Immediate Resistance: The immediate resistance lies near $48,500. Breaking above this level is crucial for the next leg up.
- Key Resistance at $48,800: Overcoming the $48,800 resistance could trigger another significant price increase, potentially paving the way towards higher targets.
- Targets Beyond $49K: The next potential stops for the bulls are $49,250 and $49,800. A sustained push beyond these levels would build confidence for a test of the psychological $50,000 resistance.
- The Big $50,000 Hurdle: $50,000 remains a significant psychological and technical resistance level. A successful break above this could signal a strong continuation of the bull run.
Potential Downside Correction: What to Watch For?
While the bullish momentum is strong, it’s crucial to consider potential downside scenarios. No market moves in a straight line, and Bitcoin could experience a correction.
- Failure to Break $48,800: If Bitcoin fails to overcome the $48,800 resistance, a downside correction becomes more likely.
- Immediate Support at $48,000: The $48,000 level and the bullish trendline provide immediate support. A break below this could signal weakening bullish momentum.
- Key Support at $47,650: The next major support is around $47,650, coinciding with the 50% Fibonacci retracement level. A close below this level could accelerate the downside correction.
- Potential Drop to $46,500: In a bearish scenario, if the $47,650 support fails to hold, Bitcoin could potentially retrace towards the $46,500 support zone.
Technical Indicators at a Glance
Let’s quickly look at the technical indicators to gauge the current market sentiment:
- Hourly MACD: The MACD is showing signs of losing pace in the bullish zone, suggesting potential weakening momentum.
- Hourly RSI: The Relative Strength Index (RSI) for BTC/USD is hovering near the 50 level, indicating a neutral to slightly bullish stance, not yet in overbought territory.
- Major Support Levels: $48,000, followed by $47,650.
- Major Resistance Levels: $48,500, $48,800, and $50,000.
Key Takeaways & What’s Next for Bitcoin?
Bitcoin’s reclaim of the $48,000 level is a positive development, suggesting renewed bullish interest. The path towards $50,000 is becoming clearer, but it won’t be without hurdles. Traders and investors should closely monitor the key resistance levels at $48,500 and $48,800. Maintaining support above $48,000 and the bullish trendline is crucial for sustaining the upward momentum.
While the bulls are currently in control, potential downside corrections should not be ruled out. Keeping an eye on the support levels at $48,000 and $47,650 will be important to gauge the strength of any potential pullback.
Will Bitcoin conquer $50,000? The coming days will be crucial in determining if this bull run has the legs to reach new heights. Stay tuned for further updates!
Disclaimer: The information provided is not trading nor financial advice. Bitcoinworld.co.in holds no liability for any trading or investments made based on the information provided on this page. We strongly recommend independent research and/or consultation with a qualified professional before making any trading or investment decisions.
#Binance #WRITE2EARN
Disclaimer: The information provided is not trading advice, Bitcoinworld.co.in holds no liability for any investments made based on the information provided on this page. We strongly recommend independent research and/or consultation with a qualified professional before making any investment decisions.