
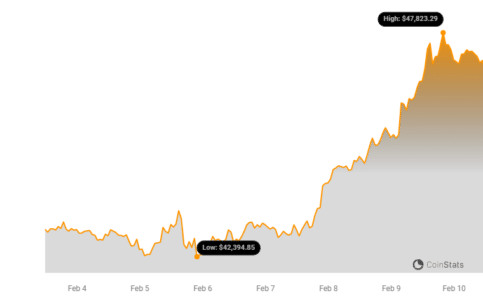
Bitcoin is back in the spotlight! Did you blink and miss it? The price of Bitcoin just smashed through the $47,000 barrier, sending ripples of excitement (and maybe a little FOMO) across the crypto market. This impressive leap has everyone from seasoned investors to curious onlookers wondering: What’s driving this surge?
Well, buckle up, because we’re diving deep into the three key factors fueling Bitcoin’s latest bull run. It’s a potent cocktail of fresh capital pouring into spot Bitcoin ETFs, intriguing moves in the futures market, and a classic technical breakout that’s got analysts buzzing. Let’s break it down!
1: Bitcoin ETFs: The Inflow Avalanche
Imagine a dam bursting, but instead of water, it’s money flowing into Bitcoin. That’s kind of what’s happening with spot Bitcoin ETFs. On February 8th alone, these ETFs witnessed a staggering $403 million net inflow! Even after accounting for over $101.6 million pulled out from the Grayscale Bitcoin Trust (GBTC), the net positive is undeniable.
Since their launch on January 11th, these ETFs have collectively attracted over $2.1 billion – that’s more than 200,000 BTC changing hands! This massive influx signals a clear message: mainstream investors are hungry for Bitcoin exposure, and ETFs are becoming their preferred way to get a piece of the action.
See Also: 90% Of Bitcoin HODLers in Profit As BTC Price Rises To $47K Amid Whale Accumulation
Eric Balchunas, a Bloomberg ETF guru, took to X (formerly Twitter) to highlight the ETF phenomenon:
He emphasized the meteoric rise of BlackRock’s IBIT and Fidelity’s FBTC, stating, “After just one month on the market, [BlackRock’s] IBIT and [Fidelity’s] FBTC stand out among the Top 25 ETFs by assets, with over $3 billion each.” That’s some serious momentum!
Balchunas further pointed out the intense competition among ETF issuers as a driving force: “The real unseen force here is competition. The launch of 10 ETFs on the same day, featuring some heavyweight issuers, truly spurred a hustle for inflows, showcasing an aggressive pursuit of market share.” This battle for ETF dominance is clearly benefiting Bitcoin’s price.
2: Futures Market Frenzy: Short Squeeze City
Now, let’s peek into the often-complex world of Bitcoin futures. Recently, we witnessed a significant “short squeeze” event. In simple terms, traders who were betting on Bitcoin’s price to go down (known as “shorting”) were caught off guard by the price surge. As Bitcoin climbed, these short positions started incurring losses, forcing them to buy Bitcoin to cover their positions and limit further damage. This buying pressure further amplified the price increase.
According to data from Glassnode, total liquidations in the futures market reached $52.09 million in just 24 hours. according to data from Glassnode. Notably, the largest single liquidation order occurred on Bitmex (XBTUSD), clocking in at a hefty $5.11 million.
Crypto analyst Skew weighed in on this short squeeze dynamic:
See Also: 1
“I’d say majority or a decent portion of the revenge shorts fading the grind higher were squeezed out above $45K into current price area. Spot flows even more significant here especially with longs starting to chase price. Note decreasing perp discounts more towards potential premiums in the future, if another squeeze higher occurs with high perp premiums & spot selling that would likely be the local high of this rally.”
Vetle Lunde, a Senior Analyst at K33 Research, highlighted the recovery in the CME basis (the difference between futures prices and spot prices) to pre-ETF levels. He also pointed to a significant jump in open interest (the total number of outstanding futures contracts).
“CME basis has recovered to pre-ETF levels of 15%. Open interest has surged higher amidst the recovery, growing by 15.6k BTC (16%) in the past 3 days. Virtually all growth stems from active market participants – non-ETFs. The OI among this cohort has recovered to pre ETF levels,” Lunde explained.
3: Technical Signals: The Bollinger Band Squeeze Play
For the technically inclined, the Bollinger Band Width (BBW) indicator flashed a crucial signal just before this price surge. The BBW measures volatility, and when it shrinks to very low levels, it often signals a period of “compression” – a calm before a potential storm of price movement.
Recently, the BBW dipped as low as 0.11, indicating just such a squeeze was building. Historically, when the BBW has reached similar lows, Bitcoin has often experienced significant price swings shortly after. Let’s take a quick look at some past examples:
- October 2023: BBW hit a low point, followed by a rally of over 30% in just 10 days.
- Mid-August 2023: Another BBW dip preceded a 15% price drop in 8 days.
- Early January 2023: Low BBW levels teed up an impressive 40% surge in just 17 days.
These historical patterns suggest the BBW can be a valuable tool for spotting potential Bitcoin breakouts (or breakdowns!). And this recent BBW signal proved to be a reliable indicator once again.
As of press time, BTC was traded at $47,053.
Disclaimer: The information provided is not trading nor financial advice. Bitcoinworld.co.in holds no liability for any trading or investments made based on the information provided on this page. We strongly recommend independent research and/or consultation with a qualified professional before making any trading or investment decisions.
#Binance #WRITE2EARN
Disclaimer: The information provided is not trading advice, Bitcoinworld.co.in holds no liability for any investments made based on the information provided on this page. We strongly recommend independent research and/or consultation with a qualified professional before making any investment decisions.