

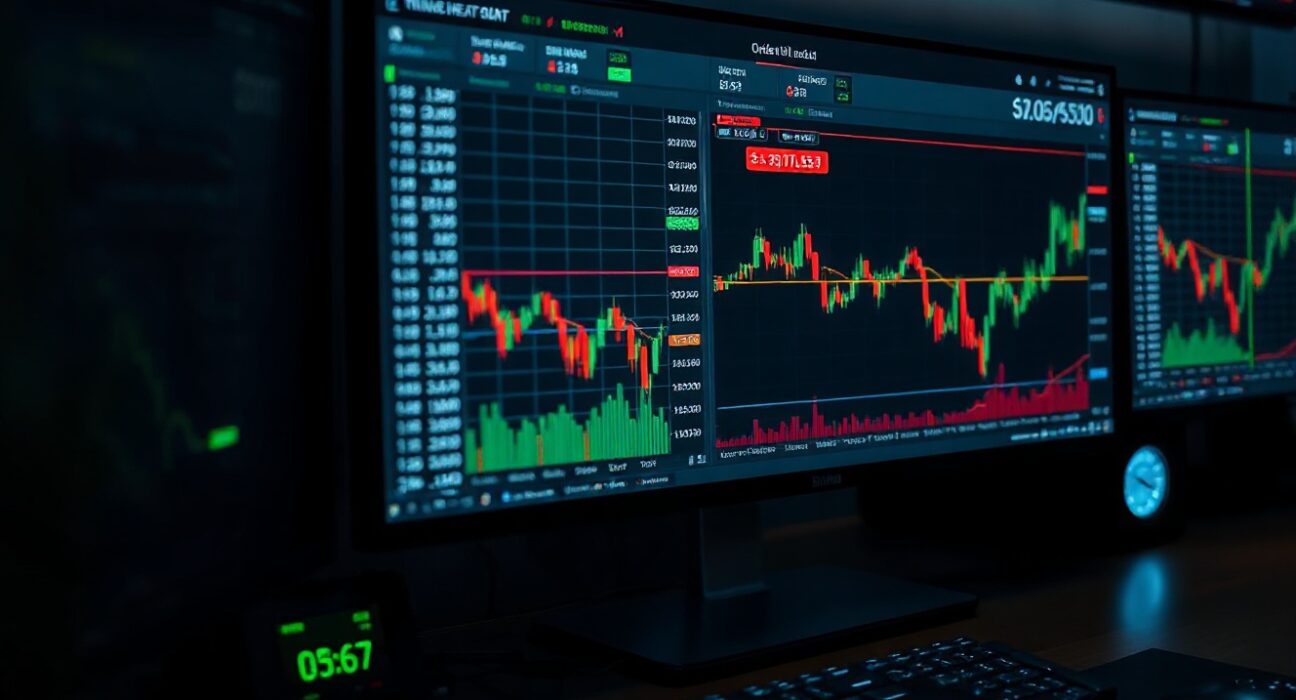
At 11:00 a.m. UTC on Aug. 4, the Bitcoin spot market is under the microscope as traders analyze the cumulative volume delta (CVD) for the BTC/USDT pair. This metric, derived from order-book activity, offers a granular view of buying and selling pressure that can inform short-term price movements. The chart in question pairs a volume heatmap with CVD lines, providing a dual-lens perspective on market dynamics.
Understanding the Volume Heatmap
The upper panel of the chart displays a volume heatmap, which tracks trading activity across different price levels. Brighter zones indicate areas where the price has either lingered for an extended period or moved sharply, suggesting that these levels may act as support or resistance. For traders, these bright spots often represent liquidity pools where significant orders have been executed, making them critical levels to watch for potential reversals or breakouts.
Decoding Cumulative Volume Delta (CVD)
The lower panel presents the CVD indicator, which aggregates buy and sell orders by size. When buy orders dominate, the corresponding line rises; conversely, sell pressure pushes it down. The chart distinguishes between order sizes: the yellow line represents orders between $100 and $1,000, typically retail traders, while the brown line tracks large orders between $1 million and $10 million, often institutional activity. This separation allows analysts to gauge whether the market is being driven by retail sentiment or large-scale capital flows.
Why This Matters for Bitcoin Traders
Understanding CVD can provide a significant edge in a market where price action often lags behind order-flow shifts. A rising CVD, especially in the large-order category, may signal accumulation by institutional players, potentially foreshadowing upward momentum. Conversely, a declining CVD with heavy sell volume could indicate distribution and a possible pullback. By combining the heatmap’s support/resistance levels with CVD’s flow direction, traders can better time entries and exits.
Context and Market Implications
This analysis comes at a time when Bitcoin is navigating a volatile period, with macroeconomic factors and regulatory news influencing sentiment. The 11:00 a.m. UTC timestamp is notable as it often aligns with the opening of European markets, which can bring increased liquidity and volatility. For day traders and swing traders, this chart offers actionable data points, but it is essential to remember that no single indicator is foolproof. CVD should be used in conjunction with other technical tools and fundamental analysis.
Conclusion
The BTC/USDT spot CVD chart at 11:00 a.m. UTC on Aug. 4 provides a real-time snapshot of order-book dynamics. By interpreting the volume heatmap and CVD lines, traders can identify potential support and resistance levels while gauging the strength of buying or selling pressure. As always, market conditions can change rapidly, so this data should be viewed as one piece of a broader analytical framework.
FAQs
Q1: What is cumulative volume delta (CVD)?
CVD is an indicator that measures the net difference between buying and selling volume, based on the aggressor side of each trade. It helps traders understand whether buyers or sellers are more active, which can indicate market direction.
Q2: How does the volume heatmap differ from CVD?
The volume heatmap shows where trading activity has been concentrated over time, highlighting price levels with high volume. CVD, on the other hand, tracks the flow of buy and sell orders cumulatively, showing the strength and direction of that volume.
Q3: Can CVD predict Bitcoin price movements?
While CVD is a useful tool for gauging order-flow pressure, it is not a predictive indicator on its own. It is best used alongside other technical analysis methods, such as trend lines, moving averages, and volume profiles, to make informed trading decisions.
Disclaimer: The information provided is not trading advice, Bitcoinworld.co.in holds no liability for any investments made based on the information provided on this page. We strongly recommend independent research and/or consultation with a qualified professional before making any investment decisions.
