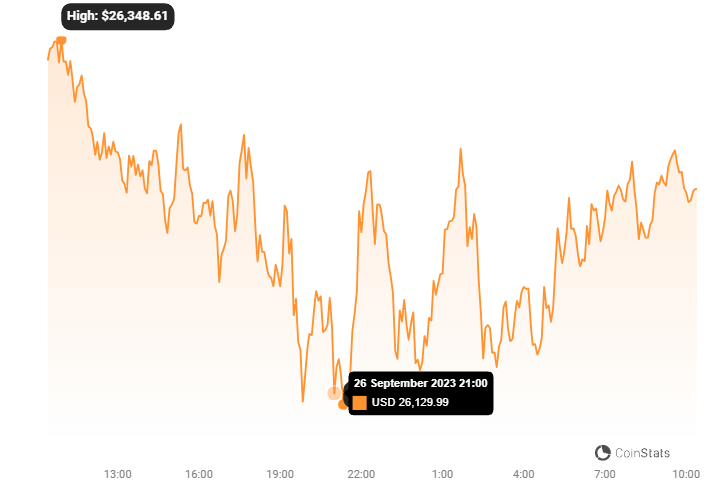
Bitcoin (BTC) is currently navigating choppy waters, finding itself pinned below a critical resistance level of $27,500. For traders and investors watching the crypto king, the question on everyone’s mind is: can Bitcoin muster the strength to break free, or are we looking at further downside?
Bitcoin’s Struggle at $26,500: What’s Happening?
As it stands, Bitcoin is trading under the $26,500 mark and remains below the 100-hourly Simple Moving Average (SMA). This technical setup suggests that bears currently have the upper hand in the short term. Let’s dive into the details:
- Key Resistance: A significant bearish trend line is forming on the hourly chart for the BTC/USD pair (data from Kraken), pinpointing resistance around $26,420. This line is a major hurdle for any potential bullish momentum.
- Price Action: Bitcoin recently experienced a dip below $26,800, breaking through support levels at $26,500 and $26,200. This downward movement pushed BTC into negative territory, eventually testing the $26,000 level and hitting a low near $26,026.

Minor Relief Rally Meets Stiff Resistance
Bitcoin did attempt a minor recovery, climbing above $26,200. This rally even pushed past the 23.6% Fibonacci retracement level, measured from the recent drop from $26,712 to $26,026. However, the 50% Fibonacci retracement level has proven to be a tough nut to crack for the bulls. It’s acting as a strong barrier, preventing any significant upward movement.
Currently, Bitcoin is still trading below $26,500 and the 100-hourly SMA, reinforcing the bearish outlook. Let’s break down the immediate levels to watch:
Immediate Resistance Levels:
- $26,400: This is the first level of resistance Bitcoin needs to overcome.
- $26,420: The key bearish trend line resistance. A break above this would be an encouraging sign for bulls.
- $26,500: The crucial level. Sustained trading above this mark is needed to shift the momentum.
What if Bitcoin Breaks Above $26,500? Bullish Scenario
If Bitcoin can decisively conquer the $26,500 resistance, we could see a shift in sentiment. Here’s what the bullish path might look like:
- Target $27,000: A successful break could propel Bitcoin towards the $27,000 resistance level.
- Eyes on $27,500: Further gains beyond $27,000 could then target the more significant $27,500 resistance – a level that has proven to be a major hurdle in the past.
What if Resistance Holds? Bearish Scenario and Downside Targets
Conversely, if Bitcoin fails to initiate a strong uptrend and remains capped below $26,500, the bearish pressure is likely to persist. Here are the key support levels to monitor on the downside:
Immediate Support Levels:
- $26,150: The first line of defense against further declines.
- $26,000: A critical support level. Breaching this could signal a more significant drop.
Deeper Downside Targets:
- $25,400: If $26,000 fails to hold, this level becomes the next potential support zone.
- $25,000: A further break below $25,400 could open the door to testing the psychological $25,000 level.
Technical Indicators: What Are They Signaling?
Let’s take a quick look at what some key technical indicators are suggesting:
- Hourly MACD (Moving Average Convergence Divergence): The MACD currently indicates bearish sentiment. This suggests that the downward momentum might continue in the short term.
- RSI (Relative Strength Index): The hourly RSI is below the 50 level. An RSI below 50 typically suggests bearish momentum, indicating that sellers are currently more dominant than buyers.
Traders are closely watching these indicators and price levels for clues about Bitcoin’s next move. These technical signals, combined with overall market sentiment, will likely dictate the short-term direction of BTC.
In Conclusion: Bitcoin at a Crossroads
Bitcoin is currently at a critical juncture. The inability to break above the $26,500 resistance level is a cause for concern for bulls. Unless Bitcoin can convincingly overcome this hurdle and the bearish trend line, the risk of further downside remains significant. Traders should be prepared for potential volatility and closely monitor the key support and resistance levels outlined above to navigate the current market conditions effectively.
Disclaimer: The information provided is not trading advice, Bitcoinworld.co.in holds no liability for any investments made based on the information provided on this page. We strongly recommend independent research and/or consultation with a qualified professional before making any investment decisions.


