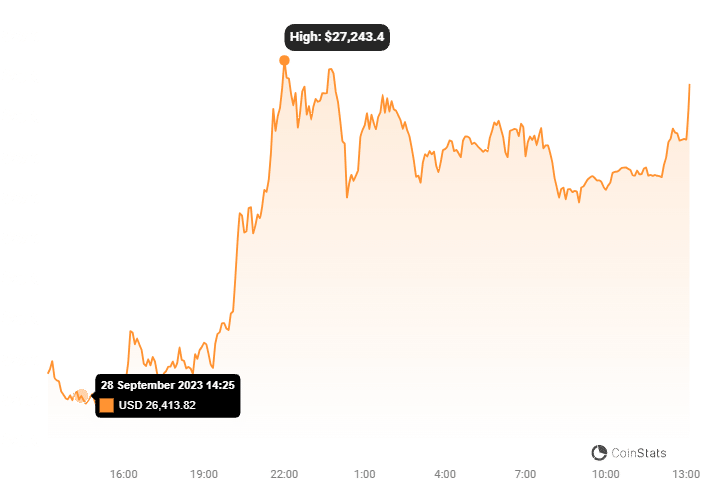
Is Bitcoin at a crossroads? The leading cryptocurrency is locked in a fascinating face-off, wrestling with key price levels that could dictate its next major move. Imagine a tug-of-war, with bulls and bears pulling with all their might. On one side, we have the formidable $26,700 resistance, a ceiling Bitcoin seems to be struggling to break through. On the other, the sturdy $26,000 support, a floor that’s so far prevented any dramatic downward plunges. Let’s dive deep into this Bitcoin price battle and see what the charts are telling us.

What’s the Current Bitcoin Price Scenario?
Currently, Bitcoin is caught in a range, testing the upper limits of resistance while finding solace in established support. Looking at the BTC/USD hourly chart from Kraken, it’s clear Bitcoin is resilient above the $26,200 mark. This level is further reinforced by the 100 hourly Simple Moving Average (SMA), acting as a dynamic support. Adding to the bullish hints, an emerging upward trend line, anchored around $26,200, is giving crypto optimists reasons to be hopeful.
- Holding Ground: Bitcoin is maintaining its position above $26,200 and the 100 hourly SMA.
- Bullish Trend Line: A newly formed trend line provides support near $26,200, suggesting potential upward momentum.
Bitcoin’s Recent Price Swings: A Rollercoaster Ride?
Bitcoin recently showed its muscle with a notable recovery from the crucial $26,000 support zone. It successfully leaped over the $26,350 and $26,500 resistance levels, even briefly touching the $26,700 mark. Excitement peaked when Bitcoin briefly flirted with $26,818. However, the bears stepped in with force, creating a strong rejection near this high. This bearish counter-attack pushed the price back down below $26,500, highlighting the strength of the resistance in this zone.
Key Resistance Levels: Where Could Bitcoin Face Hurdles?
Bitcoin’s path upwards isn’t without obstacles. Let’s identify the key resistance levels that could potentially cap its gains:
- Immediate Overhead Resistance: Around $26,450. This level is very close to the 50% Fibonacci retracement of the recent price swing from $26,818 high to $26,100 low.
- Next Challenge: $26,650. This aligns with the 76.4% Fibonacci retracement level, presenting a stronger barrier.
- Major Hurdle: $27,000. Breaking above this could signal a significant bullish move, with eyes then set on $27,500.
Fibonacci Retracement Explained: Fibonacci retracement levels are horizontal lines on a price chart that indicate potential areas of support or resistance. They are based on the Fibonacci sequence and are used to predict where a price might retrace or bounce back after a significant move. In this context, the 50% and 76.4% levels are watched as potential resistance points.
Support Levels: Where Can Bitcoin Find a Safety Net?
Conversely, understanding support levels is crucial to gauge potential downside risks. If Bitcoin fails to overcome the resistance, where could it find support?
- Immediate Support: $26,200. This level is strengthened by the bullish trend line we mentioned earlier.
- Critical Support: $26,000. This is a major psychological and technical support level.
- Deeper Support Levels: If $26,000 breaks, we could see Bitcoin testing $25,400, and further down, the $25,000 mark.
Bullish or Bearish? Decoding the Technical Indicators
To get a clearer picture of Bitcoin’s potential direction, let’s look at some technical indicators:
| Indicator | Signal | Interpretation |
|---|---|---|
| Hourly MACD (Moving Average Convergence Divergence) | Dwindling Bearish Momentum | Suggests that the selling pressure is weakening, potentially paving the way for a bullish reversal. |
| Hourly RSI (Relative Strength Index) | Hovering Above 50 | An RSI above 50 generally indicates bullish momentum. Bitcoin’s RSI above this mark is a positive sign. |
Key Takeaways: Support and Resistance Zones
Let’s summarize the crucial price levels to keep an eye on:
- Key Support Levels:
- $26,200 (Immediate Support & Trend Line)
- $26,000 (Critical Support)
- Vital Resistance Tiers:
- $26,450 (Immediate Resistance & 50% Fib Retracement)
- $26,650 (76.4% Fib Retracement)
- $27,000 (Major Resistance)
What’s the Verdict? Bitcoin’s Next Move
Bitcoin’s current situation is delicately poised. It’s caught in a battle between bulls trying to overcome the $26,700 resistance and bears defending the $26,000 support. The technical indicators offer mixed signals but hint at a potential weakening of bearish momentum. Whether Bitcoin breaks through the resistance and aims for higher levels, or succumbs to selling pressure and retests lower supports, remains to be seen.
For now, traders and investors should closely monitor these key levels. A decisive break above $26,700 could signal a bullish continuation, while a break below $26,000 might trigger further downside. As always in the crypto market, volatility is the name of the game, and only time will reveal the ultimate direction of Bitcoin’s next significant move.
Disclaimer: The information provided is not trading advice, Bitcoinworld.co.in holds no liability for any investments made based on the information provided on this page. We strongly recommend independent research and/or consultation with a qualified professional before making any investment decisions.


