
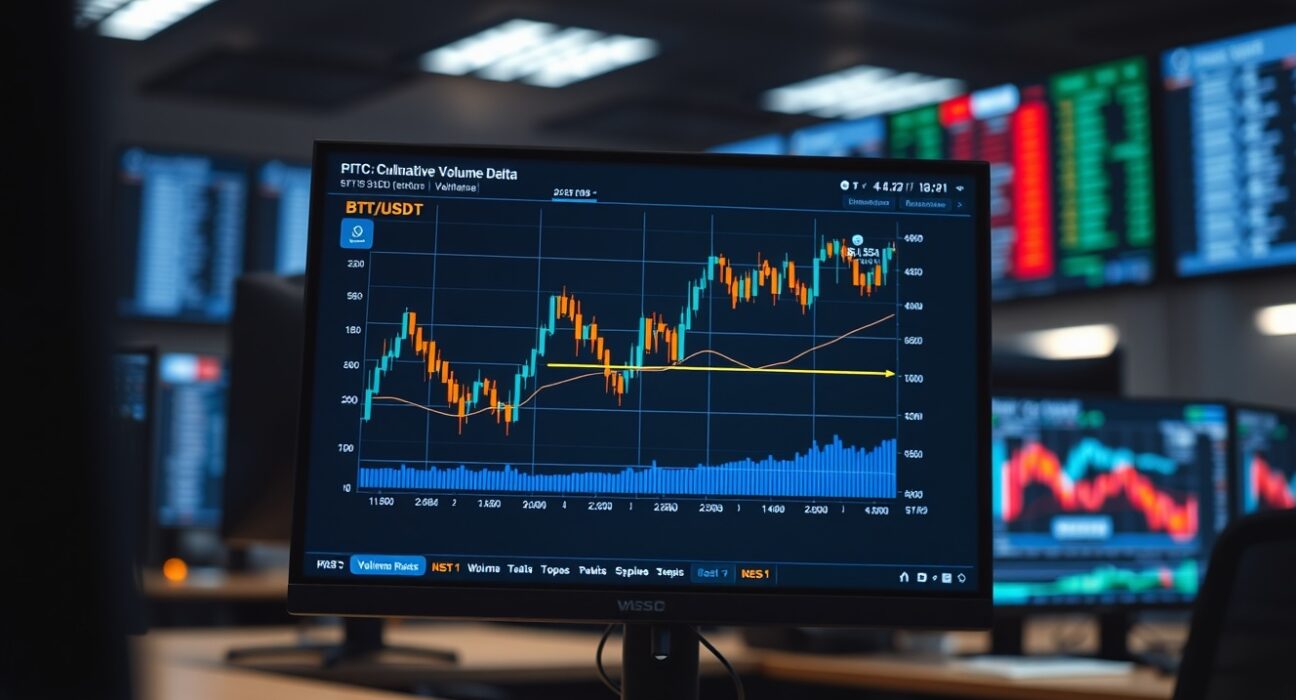
On May 11, the BTC/USDT spot market displayed notable activity in its order book, as reflected in the Cumulative Volume Delta (CVD) chart. This analysis focuses on the volume heatmap and the CVD indicator, which track trade distribution and buy-sell pressure at specific price levels.
Understanding the Volume Heatmap
The top section of the chart, known as the Volume Heatmap, visualizes trading volume concentration across different price ranges. Brighter areas indicate where the price has remained within a certain range for an extended period or where significant price movement occurred. These zones often act as potential support or resistance levels, providing traders with key reference points for market behavior.
Cumulative Volume Delta (CVD) Insights
The lower section displays the Cumulative Volume Delta (CVD) indicator, which categorizes buy and sell orders by trade size. As buying pressure increases, the corresponding colored lines rise. The yellow line represents orders between $100 and $1,000, reflecting retail-level activity. Meanwhile, the brown line tracks large orders between $1 million and $10 million, indicating institutional or whale participation.
Market Implications
For traders, monitoring the CVD alongside the volume heatmap provides a clearer picture of market sentiment. A rising CVD, particularly in the large-order category, suggests strong accumulation or distribution at key price levels. This data can help identify potential breakout or reversal points, especially when combined with the heatmap’s support and resistance zones.
Conclusion
The BTC/USDT spot CVD chart for May 11 offers a detailed view of order flow dynamics. By analyzing both the volume heatmap and the cumulative delta, traders can gain actionable insights into market structure and participant behavior. As always, this data should be used in conjunction with other technical indicators for a comprehensive trading strategy.
FAQs
Q1: What does the Cumulative Volume Delta (CVD) indicate?
A: The CVD shows the net difference between buying and selling volume, categorized by trade size. A rising line indicates stronger buying pressure, while a falling line suggests selling pressure.
Q2: How is the volume heatmap useful for trading?
A: The heatmap highlights price levels with high trading activity, which often act as support or resistance. Brighter areas signal where price has consolidated or moved significantly, helping traders identify key zones.
Q3: Why are large orders ($1M–$10M) tracked separately?
A: Large orders typically represent institutional or high-net-worth activity. Tracking them separately helps distinguish retail sentiment from major market moves, offering a clearer view of market depth.
Disclaimer: The information provided is not trading advice, Bitcoinworld.co.in holds no liability for any investments made based on the information provided on this page. We strongly recommend independent research and/or consultation with a qualified professional before making any investment decisions.