
Navigating the volatile world of cryptocurrency can feel like riding a rollercoaster. Recently, Chainlink (LINK), a prominent player in the decentralized oracle network space, has experienced some downward pressure. If you’re keeping an eye on LINK or considering it for your portfolio, understanding these price movements is crucial. Let’s dive into the latest Chainlink price analysis to unpack what’s happening.
Chainlink’s Price Performance: A Snapshot
Over the last 24 hours, Chainlink’s price has seen a decrease of 4.04%, bringing it down to $13.91. Looking at a broader timeframe, this dip is part of a continuing trend. Over the past week, LINK has experienced a 7.0% loss, falling from $15.24 to its current price point. This recent performance prompts a closer look at the factors influencing Chainlink’s market behavior.

Decoding Volatility: Bollinger Bands and Chainlink’s Price Swings
To better understand these price movements, especially in the context of the broader crypto market, it’s helpful to look at volatility. Volatility essentially measures how much the price of an asset fluctuates over time. Higher volatility means prices can swing dramatically, while lower volatility suggests more stable price movements.
One tool to visualize volatility is Bollinger Bands. These bands, represented by the gray areas in the charts below, widen when volatility increases and narrow when it decreases. Let’s examine Chainlink’s volatility over the past day and week:
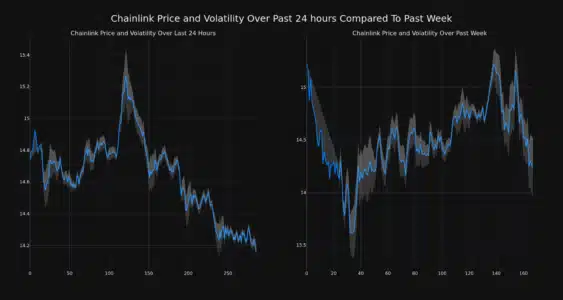
The chart on the left shows the 24-hour price movement and volatility, while the chart on the right illustrates the weekly view. Notice how the gray bands (Bollinger Bands) expand and contract? This visual representation helps us quickly grasp the degree of price fluctuation at different timeframes.
Key takeaway: Wider Bollinger Bands indicate higher volatility. If you see a large gray area, it means Chainlink’s price has been experiencing significant swings during that period.
Trading Volume and Circulating Supply: What Do They Tell Us?
Price isn’t the only metric to consider. Trading volume and circulating supply offer valuable insights into the health and dynamics of a cryptocurrency. Let’s break down Chainlink’s recent figures:

- Decreased Trading Volume: Over the past week, Chainlink’s trading volume has decreased by 15.0%. A drop in trading volume can sometimes indicate reduced investor interest or uncertainty in the market. It’s worth noting if this trend continues and whether it correlates with broader market sentiment.
- Increased Circulating Supply: Interestingly, while trading volume decreased, the circulating supply of LINK has slightly increased by 0.15% over the past week. This brings the total circulating supply to over 556.85 million coins.
Understanding Circulating Supply: The circulating supply represents the number of coins available to the public for trading. Currently, Chainlink’s circulating supply is estimated to be 55.68% of its maximum supply, which is capped at 1.00 billion LINK tokens.
Chainlink’s Market Position: Ranking and Market Cap
Despite the recent price dip, Chainlink remains a significant cryptocurrency in the market. Currently, LINK holds the #13 position in market capitalization rankings, with a market cap of $7.90 billion. Market cap, or market capitalization, is calculated by multiplying the circulating supply of a cryptocurrency by its current price. It’s a useful metric for comparing the relative size and dominance of different cryptocurrencies.
Looking Ahead: What Could Be Influencing Chainlink’s Price?
While this analysis focuses on recent price action, it’s important to remember that cryptocurrency prices are influenced by a multitude of factors. These can include:
- Broader Market Trends: The overall sentiment and performance of the cryptocurrency market, particularly Bitcoin and Ethereum, often have a significant impact on altcoins like Chainlink.
- Project Developments: News and updates related to the Chainlink network, partnerships, technology advancements, and adoption rates can influence investor confidence and price.
- Staking and Tokenomics: Chainlink’s staking mechanisms and tokenomics play a crucial role in its ecosystem. For instance, the recent launch of Chainlink Staking V0.2 is a significant development. To delve deeper into this, you can read more about Chainlink Staking V0.2 and its potential implications.
- Regulatory Landscape: Changes in regulations and government policies related to cryptocurrencies can also create market volatility and impact prices.
Read More: Chainlink Launches LINK Staking V0.2, What You Need To Know
In Conclusion: Staying Informed in the Crypto Market
Chainlink’s recent price dip and reduced trading volume are worth noting for anyone tracking this cryptocurrency. By analyzing price charts, volatility indicators like Bollinger Bands, and key metrics such as circulating supply and trading volume, we can gain a more nuanced understanding of market movements. Remember to stay informed about broader market trends, project developments, and the evolving crypto landscape to make well-rounded decisions in the dynamic world of digital assets. Keep an eye on Chainlink and the factors influencing its price as the crypto market continues to evolve.
Disclaimer: The information provided is not trading advice, Bitcoinworld.co.in holds no liability for any investments made based on the information provided on this page. We strongly recommend independent research and/or consultation with a qualified professional before making any investment decisions.