

Navigating the cryptocurrency market can feel like deciphering a complex puzzle, especially with Bitcoin (BTC) and Ethereum (ETH) constantly making headlines. Let’s break down the recent price action for these crypto giants, looking at both technical charts and what the blockchain data is telling us. Are we seeing a calm before a storm, or are there subtle shifts hinting at future trends? Let’s dive in!
BTC Analysis: Weekly to Daily Perspective
Looking at Bitcoin’s recent performance, it’s been a bit of a standstill. Since that rejection at the $25,000 mark, we haven’t seen any significant bullish momentum on the weekly charts. Think of it like a tug-of-war where neither side is gaining ground. However, the $19,000 level continues to act as a crucial support zone, a line in the sand for Bitcoin’s mid-term direction.
BTC Daily Deep Dive: What’s Brewing?
Zooming into the daily timeframe, the anticipated ‘3 tap strategy’ hasn’t materialized into any major price swings. Instead, prices have drifted back into their previous range. It’s like waiting for a catalyst that just hasn’t arrived yet. As the market evolves, we’ll be keeping an eye out for more promising strategies to emerge.
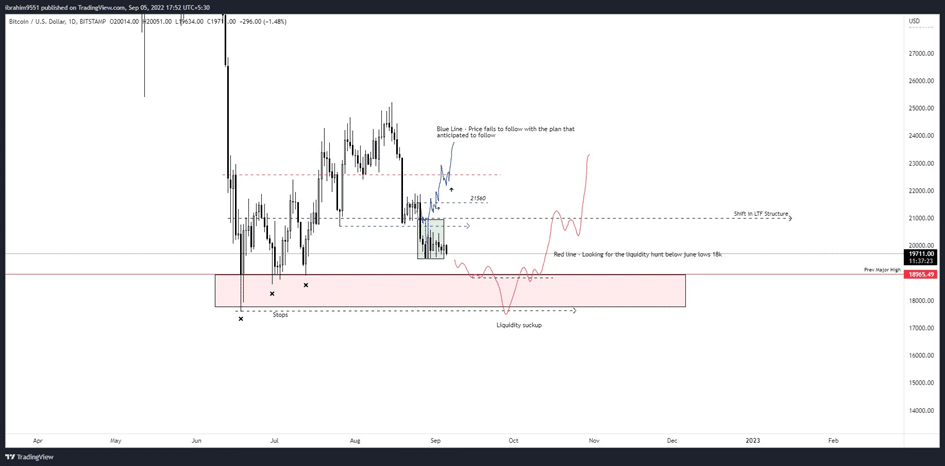
On the lower timeframes (Daily to 4-Hour), Bitcoin’s price has been consolidating for about a week. With a key event on the horizon in mid-September, we could be on the cusp of seeing increased volatility. Remember those June and July lows? While initially thought of as potential ‘3 tap’ points, they now look more like areas where stop-loss orders are resting below key weekly levels. Think of it as potential fuel for a price move, either up or down.
With these major events approaching, the coming week could inject some serious volatility into the market. We’re watching closely for potential dips below $19,000 and even $18,000 – a possible ‘liquidity suck-up’ scenario where the market briefly dips to trigger stops before a potential reversal. Reclaiming the $19,000 level could signal a bullish shift, but to confirm a more significant relief rally, Bitcoin needs to break back above $21,000.
ETH Analysis: What’s the Ethereum Story?
Daily to 4-Hour ETH Insights: A Quick Recap
Let’s take a quick look back at Ethereum’s performance last week.
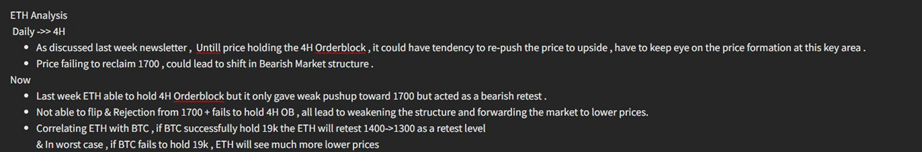
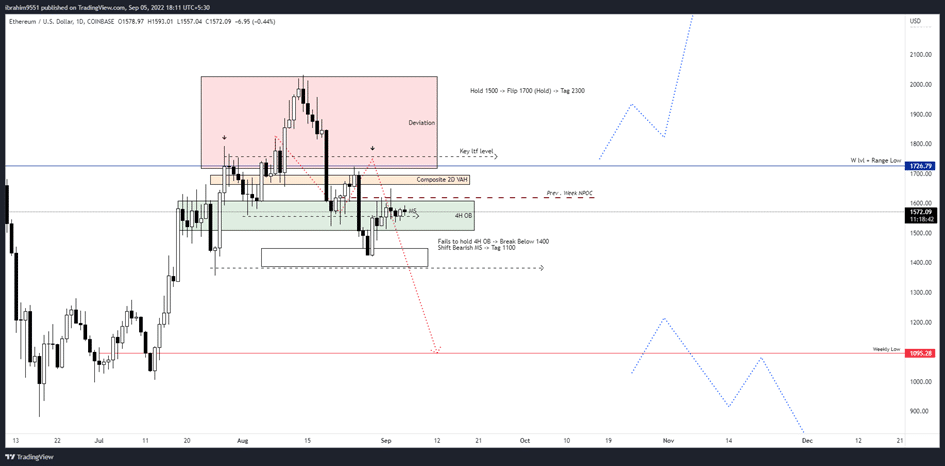
As anticipated, Ethereum tapped the $1,500 area and showed some reaction. However, the daily trend still leans bearish. The price is currently struggling to break through a 4-Hour Order Block (OB) and the previous week’s Naked Point of Control (NPOC) around $1,620. Looking ahead, the next significant hurdles are the Composite 2D Value Area High (VAH) above $1,660 and the weekly level at $1,726. These are the levels Ethereum needs to conquer to show more substantial bullish strength.
ETH 4-Hour View: Awaiting a Shift
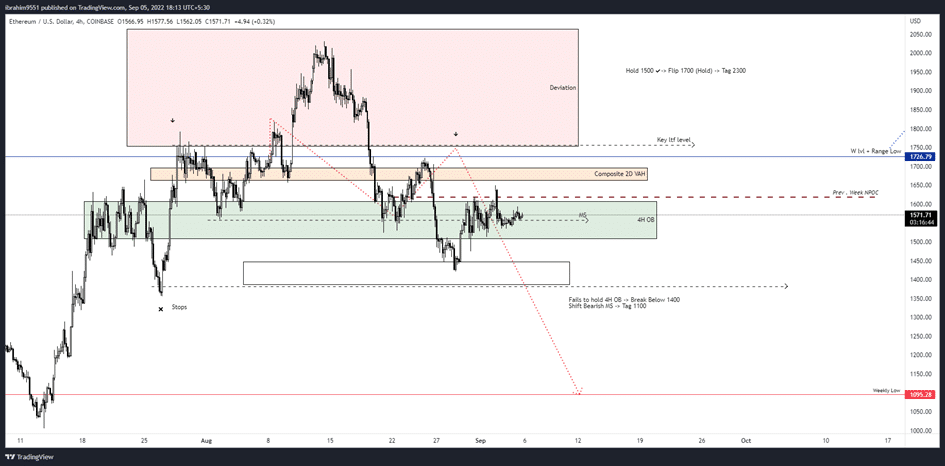
Drilling down to the 4-hour timeframe, Ethereum needs to do considerable work to signal a change in market structure. The daily trend remains bearish, and the 4-hour chart is currently showing a struggle for any upward momentum. It’s like a stalemate, waiting for a decisive move.
Now, let’s connect the dots with Bitcoin. If Bitcoin’s price dips below $18,000, potentially triggering those stop-loss orders and creating a liquidity grab, Ethereum is likely to follow suit, potentially testing lows below $1,400 or even $1,300. In a more aggressive scenario, we could even see a retest of the weekly lows from July.
On-chain Analysis: Peering Behind the Price
Beyond the charts, on-chain analysis offers valuable insights by transforming blockchain transaction data into actionable market intelligence. Think of it as looking under the hood to see what’s really driving the market.
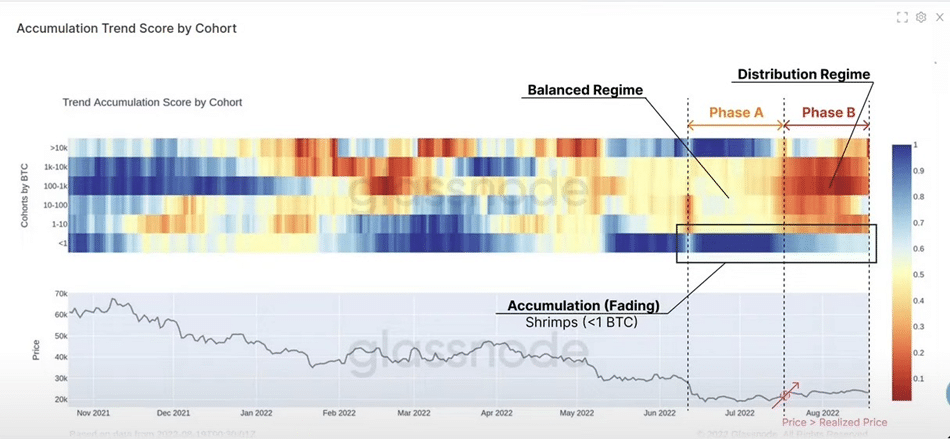
An Opportunity For Distribution? Who’s Buying and Selling?
By tracking the accumulation and distribution behavior of different wallet sizes, we can gain clues about market sentiment. Remember the lows in July when Bitcoin dipped below $20,000? Interestingly, wallets holding less than 1 BTC and those with over 10,000 BTC were net accumulators during that period. This could suggest both retail investors and large whales were buying the dip.
However, the rally back up to $25,000 seems to have presented an opportunity for distribution. Wallets holding between 100 and 10,000 BTC were particularly active in selling within that $24,000 range. This suggests that some of the larger, more sophisticated traders were taking profits.
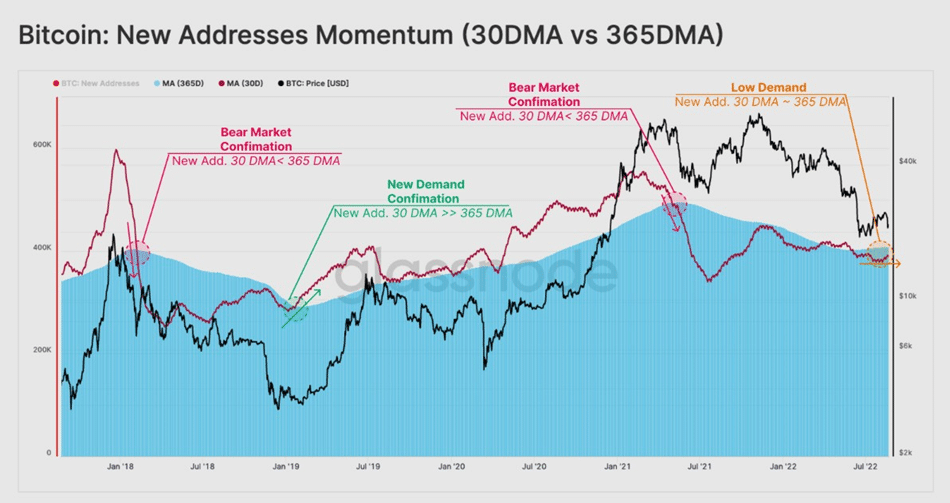
Tracking Demand via Network Activity: Are New Users Joining?
The principles of supply and demand are fundamental. The sustainability of any bull run, even within a bear market, hinges on new demand entering the market. Monitoring new addresses joining the network can provide a strong indication of this activity.
When Bitcoin’s price plummeted from its April 2021 all-time high, the 30-day moving average (DMA) of new addresses fell sharply below the 365-day moving average. Historically, this has been a strong confirmation of a bear market. Conversely, a sharp spike of the 30 DMA above the 365 DMA during consolidation phases has often signaled new demand entering the market.
Currently, the number of new addresses remains below the 365 DMA, or at least within a tight range for the past couple of months. While we aren’t seeing a surge in new users, the existing wallets are actively engaging with the network, indicating ongoing traffic.
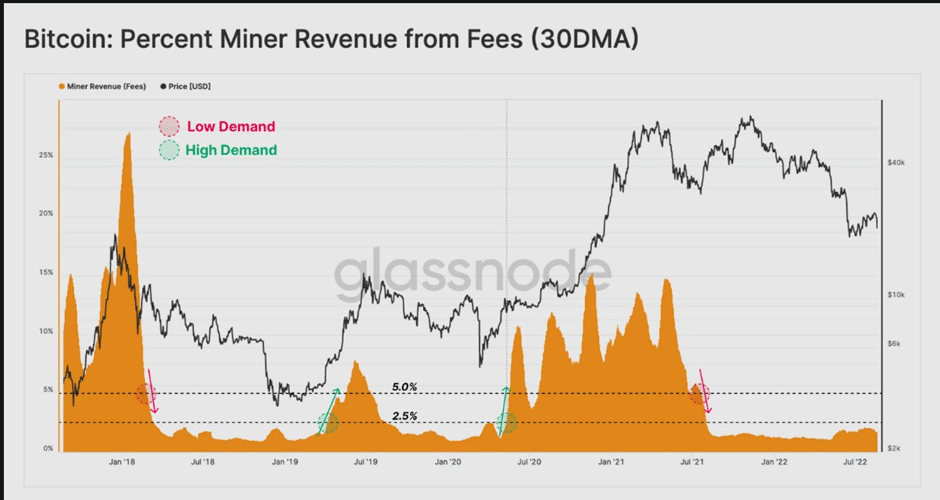
Miner Revenue From Fees: A Sign of Network Congestion?
Looking at miner revenue from transaction fees can help us gauge the competitiveness for block space and, by extension, network congestion. Higher fees generally indicate higher demand for transactions.
Historically, a range of 2.5% to 5% of miner revenue coming from fees has acted as a threshold between high and low demand. The early stages of a bear market often see a drop in these fees. Conversely, a sustained period above that 2.5%-5.0% range can be a positive sign of renewed demand.
Since July 2021, miner revenue from fees has significantly decreased and has been hovering within a tight 1%-2% range. This is considerably lower than the levels seen in the second quarter of 2020 and the first quarter of 2021, suggesting lower network demand. Interestingly, comparing the current situation to the periods between July 2019-July 2020 and July 2021-July 2022, we observe a similar compression in miner revenue during bearish phases. Following the typical market cycle, accumulation often precedes expansion, which could have implications for the future.
Key Takeaways and Looking Ahead
- Bitcoin’s Sideways Action: BTC is currently in a consolidation phase, with $19,000 acting as critical support. Keep an eye on potential volatility around mid-September.
- Ethereum’s Resistance: ETH is facing resistance around $1,620 and needs to break above $1,660 and $1,726 for a more bullish outlook.
- On-chain Insights: Large wallets appear to have distributed some holdings around the $24,000 Bitcoin level. New network activity remains subdued, and miner revenue from fees is low, typical of a bear market.
- Potential Scenarios: Be prepared for potential dips below $19,000 (BTC) and $1,400 (ETH). Reclaiming $19,000 for Bitcoin and breaking key resistance levels for Ethereum would signal potential bullish reversals.
The cryptocurrency market remains dynamic and influenced by a multitude of factors. By combining technical analysis with on-chain data, we can gain a more comprehensive understanding of the current landscape and potential future movements. Stay informed, stay cautious, and remember that this is a marathon, not a sprint.
Disclaimer: The information provided is not trading advice, Bitcoinworld.co.in holds no liability for any investments made based on the information provided on this page. We strongly recommend independent research and/or consultation with a qualified professional before making any investment decisions.