
Bitcoin’s been in a bit of a lull lately, hasn’t it? Stuck in a trading range, like it’s decided to take a breather. But while Bitcoin chills, a crucial question pops up for altcoin enthusiasts: Could this sideways shuffle be the perfect springboard for altcoins to shine? Think about it – when the big boss coin is quiet, traders often start looking for action elsewhere. And where do they look? You guessed it – altcoins!
Trending moves are the lifeblood of trading excitement. Stagnant prices? Not so much. Bitcoin’s been range-bound for months, and it shows. Bloomberg pointed out a hefty 52% drop in Coinbase’s spot trading volume in Q3 2023 compared to last year. That’s a significant dip, highlighting how Bitcoin’s sideways action can cool down the overall market buzz.
Now, nobody has a crystal ball, but history tells us that long periods of consolidation often lead to explosive price movements. The million-dollar question is, which way will it break? The bulls have been pretty resilient, holding Bitcoin above $25,000 for quite some time now. That definitely fuels the idea of a potential bullish breakout.
Adding another layer to the mix, renowned investor Paul Tudor Jones recently voiced concerns about the equities markets in a CNBC interview. He’s worried about the escalating Israel-Hamas conflict and how it could trigger a risk-off sentiment. In that kind of environment, traditional safe havens like gold and, interestingly, Bitcoin, could see a surge.
So, here’s the big question: Can the bears push Bitcoin below its immediate support and trigger a wider market downturn? Or will the bulls maintain control and set the stage for an altcoin rally? Let’s dive into the charts of the top 10 cryptocurrencies and see what stories they’re telling us.
Bitcoin (BTC) Price Analysis: Will Bulls Hold $26,000 Support?
Bitcoin took a dip below the 20-day EMA ($27,148) on October 11th. The bears were feeling confident, but they couldn’t crack the 50-day SMA at $26,634. Bulls defended this level like pros on October 11th and 12th. However, despite their efforts, a strong rebound hasn’t materialized. This suggests buyers aren’t rushing in at these higher prices.

https://coinstats.app/coins/bitcoin/
Bears will likely aim to break below the 50-day SMA. If they succeed, watch out for a potential drop to the $26,000 support – a level where bulls are expected to step in and buy.
On the flip side, a rally above the 20-day EMA would be the first sign of strength. If Bitcoin can manage that, a move towards the $28,143 overhead resistance becomes possible. Breaking through that could signal the start of a short-term uptrend.
Ethereum (ETH) Price Analysis: Can Bulls Push Past Moving Averages?
Ethereum danced dangerously close to the $1,531 support on October 12th, but the bulls held their ground. The Relative Strength Index (RSI) is showing a potential positive divergence, hinting that the bearish momentum might be losing steam. However, expect a battle as bulls try to push the price towards the moving averages – bears are likely waiting to defend those levels.

https://coinstats.app/coins/ethereum/
If the price turns down sharply from the 20-day EMA (currently at $1,606), it would indicate bears are still in control. This could lead to a break below $1,531 and a further slide towards $1,368. For bulls to regain control, they need to conquer the moving averages, potentially paving the way to $1,746, though expect strong resistance from bears there.
BNB Price Analysis: Will $203 Support Hold Strong?
BNB took a tumble towards the $203 support, facing strong selling pressure. The long tail on the candlestick shows bulls fiercely defended this crucial level. Now, bulls need to push the price above the moving averages and the downtrend line to signal that bearish pressure is easing. Success here could trigger an upward move towards $235 and potentially $250.

https://coinstats.app/coins/binance-coin/
Conversely, if the price reverses from the moving averages, it would confirm the bearish outlook. Each minor rally would be seen as a selling opportunity. A break below $203 would complete a descending triangle pattern, potentially starting a downtrend towards $183.
XRP Price Analysis: Stuck in a Range Between $0.41 and $0.56?
XRP dipped below the uptrend line on October 11th, suggesting weakening bullish momentum. Expect XRP to trade within a range of $0.41 to $0.56 for a while. Currently at $0.46, the immediate support level is crucial. Breaking below it could trigger a drop to $0.41, where bulls are expected to defend the lower end of the range.
https://coinstats.app/coins/ripple/
On the other hand, a break and close above the moving averages would be the first sign of strength. This could encourage buyers to attempt another push towards the $0.56 overhead resistance. A successful break above that could signal a potential new uptrend.
Solana (SOL) Price Analysis: Will Bears Target $17.33?
Solana slipped below the 20-day EMA ($21.72) on October 12th, indicating continued bearish pressure. Both moving averages are flattening, and the RSI is near the midpoint, showing a balance between buyers and sellers. Bears are likely aiming to push the price below the 50-day SMA at $20.44. If they succeed, SOL/USDT could drop towards the critical $17.33 level.
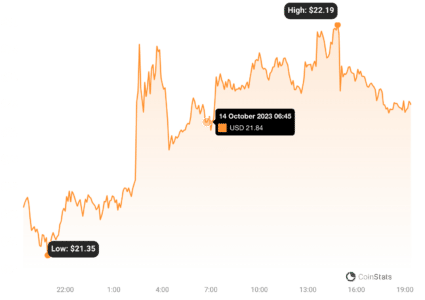
https://coinstats.app/coins/solana/
However, a reversal above $22.50 would change the picture. It would give bulls a short-term advantage and potentially trigger a rally towards the neckline of an inverse head and shoulders pattern.
Cardano (ADA) Price Analysis: Is a Relief Rally on the Cards?
Cardano has shown long tails on candlesticks since October 9th, suggesting some buying interest. However, rallies have been weak, indicating a lack of strong demand at higher levels. ADA/USDT is near the $0.24 support line, and the RSI shows a positive divergence, hinting at weakening selling pressure and a possible relief rally. The first hurdle for bulls is the moving averages, and breaking above that could lead to $0.27 and then $0.28.
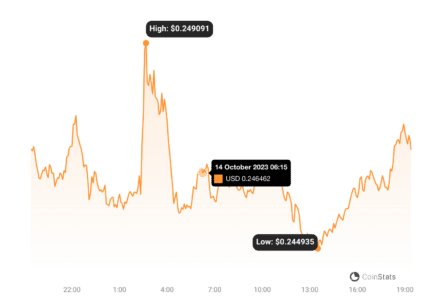
https://coinstats.app/coins/cardano/
Alternatively, a break below $0.24 would confirm bearish momentum and could lead to a drop to $0.22 or even $0.20.
Dogecoin (DOGE) Price Analysis: Will $0.055 Support Hold the Line?
Dogecoin has been stuck below the $0.06 resistance since October 9th. Bears are now aiming to test the $0.055 support, which is expected to be defended by bulls.
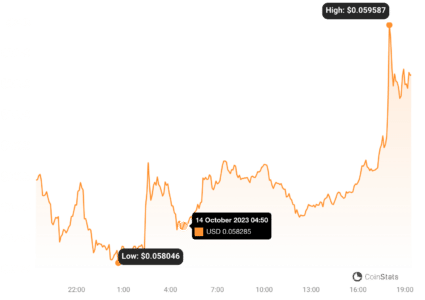
https://coinstats.app/coins/dogecoin/
If the price bounces from $0.055, expect consolidation between $0.055 and $0.06 for a while. With downward sloping moving averages and the RSI near oversold territory, bears currently have the upper hand. Bulls need to push the price above the moving averages to trigger a recovery towards $0.07.
Toncoin (TON) Price Analysis: Bear Trap or Further Decline to $1.60?
Toncoin (TON) has been correcting downwards as traders took profits, pushing the price below the 50-day SMA at $1.98 on October 12th. Bulls are now trying to reclaim this level and push the price back above the moving averages. Success here would suggest the drop below the 50-day SMA was a bear trap, potentially leading to a rally towards $2.31.
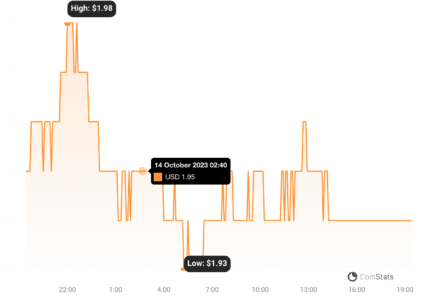
https://coinstats.app/coins/the-open-network/
However, a reversal from the moving averages would signal a change in sentiment, with rallies being sold into. This would increase the risk of a drop to $1.60.
Polkadot (DOT) Price Analysis: Will $3.50 Support Hold Firm?
Polkadot continued its downtrend, reaching the $3.50 target on October 12th. This level is now acting as strong support. The 20-day EMA at $3.95 is a key level to watch. If the price faces resistance and turns down from this level, it would indicate sellers are using rallies to exit positions, increasing the chance of a break below $3.50.
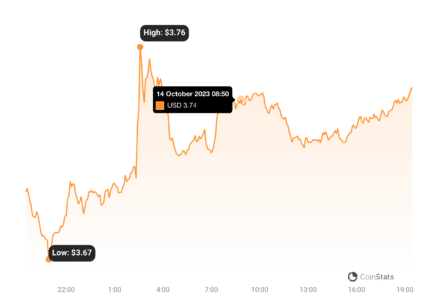
https://coinstats.app/coins/polkadot/
Alternatively, bulls could stage a reversal and sustain the price above the 20-day EMA. This would indicate rejection of lower prices, potentially trapping aggressive bears and triggering a short squeeze towards the downtrend line.
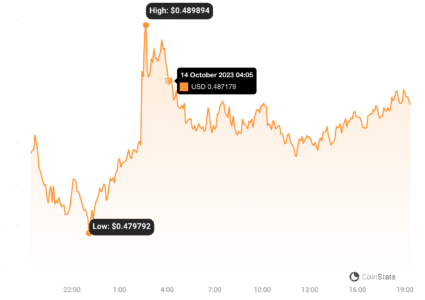
Polygon (MATIC) Price Analysis: Buying Opportunity at $0.49 Support?
Polygon seems to be heading towards the $0.49 support, suggesting bulls aren’t eager to buy at higher prices. In range-bound markets, traders often buy near support and sell near resistance. For Polygon, expect buying interest to pick up as the price approaches $0.49. A strong bounce from this level could push MATIC/USDT towards the moving averages.

https://coinstats.app/coins/matic-network/
However, a sharp rejection from the moving averages could lead to a break below $0.49, potentially sending the pair down to $0.45. Conversely, a rally beyond the moving averages would suggest the range-bound action might continue for a bit longer.
Navigating the Crypto Seas: Stay Vigilant!
This deep dive into the cryptocurrency markets reveals a dynamic and potentially volatile landscape. Each coin presents its own unique story and trading opportunities. Whether you’re a seasoned trader or just starting your crypto journey, understanding these nuances is crucial. The crypto market is always in motion, influenced by factors ranging from Bitcoin’s price action to global events.
Key Takeaways for Traders:
- Bitcoin’s Sideways Trend: Bitcoin’s current range-bound trading might be signaling a potential shift in market focus towards altcoins.
- Support and Resistance Levels: Pay close attention to the key support and resistance levels mentioned for each cryptocurrency. These are critical zones for potential price reversals or breakouts.
- Moving Averages & RSI: Use moving averages (20-day EMA, 50-day SMA) and RSI to gauge momentum and potential trend changes.
- Market Sentiment: Be aware of overall market sentiment, influenced by factors like Bitcoin’s price action and global events (e.g., geopolitical conflicts).
- Risk Management: Always practice prudent risk management. The cryptocurrency market is volatile, and price predictions are not guaranteed.
In conclusion, while Bitcoin decides its next move, altcoins are presenting intriguing possibilities. Stay informed, stay vigilant, and navigate the crypto markets with a keen eye and a well-thought-out strategy!
Disclaimer: The information provided is not trading advice, Bitcoinworld.co.in holds no liability for any investments made based on the information provided on this page. We strongly recommend independent research and/or consultation with a qualified professional before making any investment decisions.