Cryptocurrency markets are known for their rapid shifts, and Kaspa (KAS) is no exception. If you’re keeping an eye on Kaspa, you’ve likely noticed some interesting price action recently. Let’s break down the latest movements and see what’s driving Kaspa’s price.
Kaspa (KAS) Price Action: A 24-Hour Snapshot
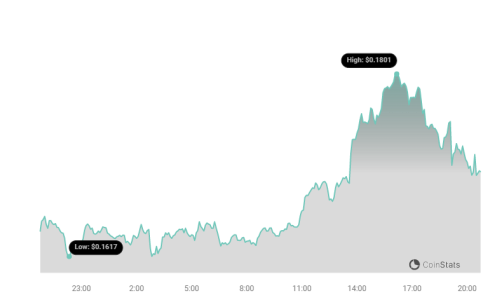
In the last 24 hours, Kaspa (KAS) has shown a positive uptick, increasing by 4.23%. This brings the current price to $0.17. This surge offers a glimmer of hope for KAS holders, especially considering the slightly bearish trend observed over the past week.
However, before we get too excited, it’s crucial to look at the bigger picture.
Weekly Performance: A Step Backwards?
While the last 24 hours are encouraging, the past week tells a slightly different story. Over the last seven days, Kaspa has actually experienced a 6.0% decrease in price. It moved from $0.18 down to the current $0.17 level. This weekly dip suggests that the recent 24-hour surge might be a short-term correction rather than a complete trend reversal.
To put it simply:
- Last 24 Hours: Kaspa price is UP by 4.23%
- Past Week: Kaspa price is DOWN by 6.0%
This contrasting performance highlights the inherent volatility in the crypto market and specifically in Kaspa.
Kaspa’s Price Context: Still Below All-Time High
For those tracking Kaspa’s overall journey, it’s important to remember its peak. The current all-time high for KAS remains at $0.19. While the recent 24-hour increase is positive, Kaspa still needs to climb further to retest and potentially surpass this high.
Volatility Check: What Do Bollinger Bands Tell Us?
To understand the degree of price fluctuation, we can look at volatility. The provided chart uses Bollinger Bands, a popular technical analysis tool, to visualize Kaspa’s volatility over both 24-hour and weekly periods.
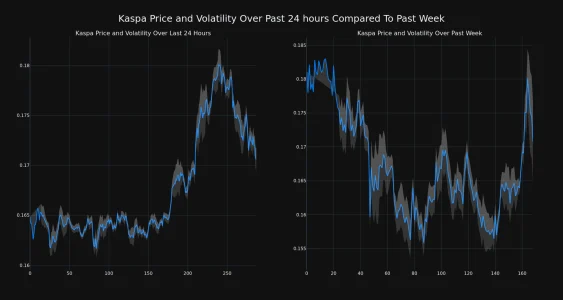
Bollinger Bands Explained Simply:
- These bands (the gray areas in the chart) measure how much the price of Kaspa is moving up and down.
- Wider bands = Higher volatility. A larger gray area indicates more significant price swings.
- Narrower bands = Lower volatility. A smaller gray area suggests less price fluctuation.
By observing the width of the Bollinger Bands, traders and investors can gauge the risk and potential price movement associated with Kaspa at different timeframes.
Trading Volume and Circulating Supply: Key Indicators
Beyond price and volatility, two other metrics offer insights into Kaspa’s market dynamics:
- Trading Volume: This represents the total amount of KAS coins traded within a specific period. A decrease in trading volume can sometimes indicate waning interest or consolidation in the market. In Kaspa’s case, the trading volume has decreased by 29.0% over the past week.
- Circulating Supply: This is the number of KAS coins currently in circulation and available to trade. An increase in circulating supply can, in some cases, exert downward pressure on price if demand doesn’t keep pace. Kaspa’s circulating supply has increased by 0.96% over the past week.
Currently, the circulating supply of KAS is 23.91 billion coins. This represents a significant portion – approximately 83.28% – of its total maximum supply of 28.70 billion coins.
Market Cap and Ranking: Where Does Kaspa Stand?
Market capitalization (market cap) is a crucial metric for understanding a cryptocurrency’s size and dominance. As per the latest data, Kaspa’s market cap is $4.10 billion. This places KAS at rank #29 in the overall cryptocurrency market rankings. A strong market cap and ranking generally indicate a more established and potentially less risky cryptocurrency compared to lower-ranked, smaller-cap coins.
Key Takeaways on Kaspa’s Recent Price Movement
Let’s summarize the key points about Kaspa’s recent performance:
- Short-Term Positive Momentum: Kaspa has seen a 4% price increase in the last 24 hours, offering a positive signal to investors.
- Weekly Downtrend Persists: Despite the daily surge, Kaspa is still down 6% over the past week, indicating ongoing bearish pressure.
- Volatility Remains a Factor: Bollinger Bands highlight the ongoing volatility in Kaspa’s price, typical of the crypto market.
- Decreasing Trading Volume: A drop in trading volume might suggest reduced market participation or a period of consolidation.
- Increasing Circulating Supply: The slight increase in circulating supply is something to monitor for potential price impact.
- Solid Market Cap and Ranking: Kaspa maintains a strong market cap and top 30 ranking, reflecting its position in the crypto space.
Looking Ahead: What’s Next for KAS?
Predicting cryptocurrency prices with certainty is impossible. The crypto market is influenced by numerous factors, including broader market sentiment, technological developments, regulatory news, and more.
For Kaspa, to sustain and build upon this recent 24-hour surge, we need to see:
- Continued positive momentum: Will the 24-hour gain extend into a multi-day uptrend?
- Increased trading volume: Higher volume would indicate stronger conviction behind the price increase.
- Broader market support: Overall positive sentiment in the crypto market can lift Kaspa along with other altcoins.
Keep monitoring Kaspa’s price action, trading volume, and broader market news to stay informed about its potential future trajectory.
Disclaimer: The information provided is not trading advice. Bitcoinworld.co.in holds no liability for any investments made based on the information provided on this page. We strongly recommend independent research and/or consultation with a qualified professional before making any investment decisions.
Disclaimer: The information provided is not trading advice, Bitcoinworld.co.in holds no liability for any investments made based on the information provided on this page. We strongly recommend independent research and/or consultation with a qualified professional before making any investment decisions.