
The cryptocurrency market never sleeps, and Ethereum (ETH), the second-largest cryptocurrency by market cap, is always making headlines. Recently, ETH has experienced some interesting price movements. Let’s dive into the latest data and understand what’s influencing Ethereum’s price.
Ethereum Price Update: A 24-Hour Snapshot
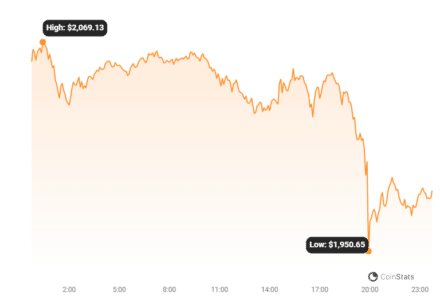
Over the past 24 hours, Ethereum’s price has seen a decrease of 5.89%, bringing it down to $1,969.21. This might raise some eyebrows, especially if you’re closely watching the market. However, it’s crucial to look at the bigger picture.
The price of Ethereum has decreased 5.89% over the past 24 hours to $1,969.21. This is contrary to the coin’s performance over the past week where it has experienced an up-trend of 7.0%, moving from $1,893.69 to its current price.
Zooming Out: Ethereum’s Weekly Performance
While the 24-hour dip might seem concerning, let’s take a step back and look at the weekly performance. Over the last week, Ethereum has actually been on an uptrend. It has increased by 7.0%, climbing from $1,893.69 to its current price. This suggests that the recent daily drop could be a short-term fluctuation within a larger positive trend.
Understanding Ethereum’s Price Volatility
Volatility is a key characteristic of the cryptocurrency market, and Ethereum is no exception. To understand these price swings better, we can look at volatility indicators like Bollinger Bands.
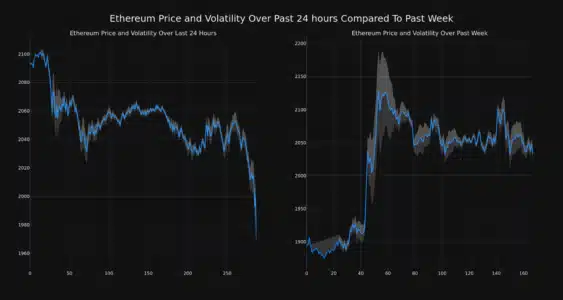
The chart below compares the price movement and volatility for Ethereum over the past 24 hours (left) to its price movement over the past week (right). The gray bands are Bollinger Bands, measuring the volatility for both the daily and weekly price movements.
Read Also: Beware, Hackers Are Using The Ethereum CREATE2 Opcode For Fraud
The wider the bands are, or the larger the gray area is at any given moment, the larger the volatility.
Bollinger Bands Explained: Gauging Market Swings
- What are Bollinger Bands? They are visual tools used in trading to measure the volatility of an asset’s price. The bands widen when volatility increases and narrow when it decreases.
- Interpreting the Charts: In the charts provided, the gray bands represent Bollinger Bands. The wider these bands are, the higher the volatility in Ethereum’s price during that period (daily or weekly).
- Daily vs. Weekly Volatility: By comparing the Bollinger Bands for the 24-hour and 7-day periods, we can see how volatility differs across these timeframes. This helps in understanding short-term fluctuations versus longer-term trends.
Key Market Indicators for Ethereum
Beyond price and volatility, several other indicators provide a more complete picture of Ethereum’s market health. Let’s look at trading volume and circulating supply.
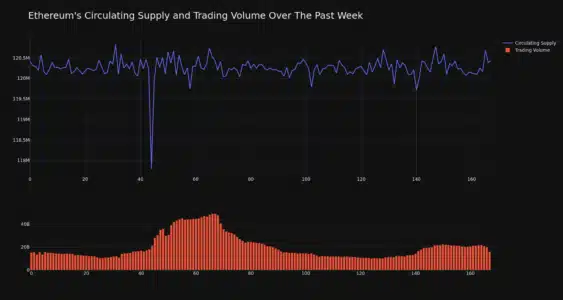
The trading volume for the coin has increased 5.0% over the past week while the overall circulating supply of the coin has increased 0.02% to over 120.26 million. The current market cap ranking for ETH is #2 at $240.00 billion.
Analyzing Trading Volume and Circulating Supply
- Trading Volume Increase: The trading volume for ETH has increased by 5.0% over the past week. An increase in trading volume can often indicate growing interest and activity in the market. It can sometimes precede significant price movements, either upward or downward.
- Circulating Supply: The circulating supply of ETH has slightly increased by 0.02%, now standing at over 120.26 million coins. Changes in circulating supply are important to monitor as they can influence the supply-demand dynamics and potentially impact price over the long term.
- Market Cap Ranking: Ethereum remains firmly in the #2 position in market cap ranking, with a market capitalization of $240.00 billion. This highlights its strong position and investor confidence within the crypto ecosystem.
What Does This Mean for Ethereum?
Ethereum’s recent price action presents a mixed bag. While the 24-hour dip is noticeable, the weekly uptrend and increased trading volume suggest underlying strength. The slight increase in circulating supply is a factor to watch, but Ethereum’s dominant market position remains unchallenged.
Key Takeaways:
- Short-term Dip, Long-term Trend? The 24-hour price decrease might be a temporary pullback within a larger upward trend.
- Volatility is Normal: Cryptocurrency markets are volatile. Bollinger Bands help visualize and understand these fluctuations.
- Monitor Key Metrics: Trading volume and circulating supply provide valuable insights into market dynamics.
Disclaimer
It’s crucial to remember that the cryptocurrency market is inherently risky and subject to rapid changes. This analysis is for informational purposes only and not financial advice.
Disclaimer: The information provided is not trading advice. Bitcoinworld.co.in holds no liability for any investments made based on the information provided on this page. We strongly recommend independent research and/or consultation with a qualified professional before making any investment decisions.
Before making any investment decisions in Ethereum or any cryptocurrency, always:
- Do Your Own Research (DYOR): Stay informed about market trends, technology developments, and regulatory news.
- Seek Professional Advice: Consult with a qualified financial advisor who can provide personalized guidance based on your financial situation and risk tolerance.
In Conclusion: Staying Informed in the Dynamic Crypto World
Ethereum’s price movements are a constant topic of discussion in the crypto community. By analyzing price charts, understanding volatility, and keeping an eye on key metrics like trading volume and circulating supply, we can gain a more nuanced perspective on market dynamics. Remember to stay informed, do your research, and approach crypto investments with caution and awareness of the risks involved. The world of crypto is ever-evolving, and continuous learning is your best tool for navigating it successfully.
Disclaimer: The information provided is not trading advice, Bitcoinworld.co.in holds no liability for any investments made based on the information provided on this page. We strongly recommend independent research and/or consultation with a qualified professional before making any investment decisions.