
Cryptocurrency enthusiasts are buzzing as Ethereum (ETH) showcases a significant bullish momentum! Following in Bitcoin’s footsteps, ETH has broken through key resistance levels and is currently trading above $2,200. Let’s dive into the details of this impressive surge and explore what’s next for the second-largest cryptocurrency.
Ethereum’s Bullish Breakout: What Fueled the Rally?
Ethereum has demonstrated remarkable strength, initiating a robust climb beyond the $2,000 mark, mirroring Bitcoin’s positive trajectory. This surge wasn’t just a minor uptick; ETH decisively shattered several resistance barriers around $2,120, propelling it into a solid positive zone. The price even confidently surpassed the $2,200 threshold, signaling a strong intent for further upward movement.
- Strong Momentum: ETH is currently up by over 8%, reflecting strong buying interest.
- Breaching Key Levels: Successfully moved above $2,200 and the 100-hourly Simple Moving Average (SMA), indicating bullish strength.
- Eyes on $2,500: With the current momentum, Ethereum is setting its sights on the $2,500 resistance level in the near future.
Currently, as of press time, Ethereum is trading around $2,203, having experienced a minor dip below $2,200 before regaining its upward trajectory. This resilience showcases the underlying strength of the current bullish trend.
Navigating Resistance and Support Levels
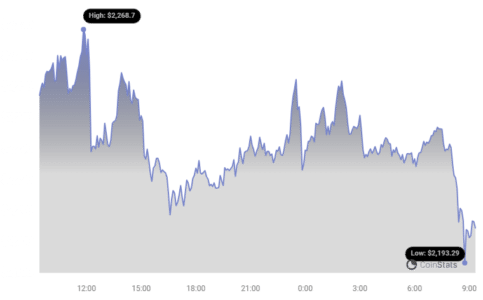
Ethereum recently reached a new multi-month peak near $2,275 and is currently consolidating these gains. We saw a slight dip below the 23.6% Fibonacci retracement level (measured from the $2,148 swing low to the $2,275 high), but ETH quickly bounced back, reaffirming its position above $2,200 and the 100-hourly SMA. This consolidation phase is crucial as it prepares ETH for its next potential leg up.
Looking at the hourly chart for ETH/USD, a key bullish trend line is forming with support around $2,225. On the upside, the immediate challenge lies at the $2,250 resistance zone.
Breaking through the $2,250 resistance is vital for Ethereum to target the next key level at $2,275. A decisive move above $2,275 could pave the way for a surge towards $2,320, followed by $2,350. Should the bullish momentum persist, the ultimate goal is to reach the significant $2,500 resistance level. Can ETH achieve this milestone? Market sentiment suggests it’s a strong possibility!
See Also: ORDI Price Surges 35% And Has Been Increasing Remarkably
Are Ethereum Dips a Buying Opportunity? Analyzing Potential Pullbacks
What happens if Ethereum encounters resistance at $2,250? A downside correction is certainly possible. In such a scenario, the initial support to watch is around $2,220 and the established trend line. This level is expected to act as the first line of defense against any downward pressure.
Further down, the next significant support zone is at $2,175, coinciding with the 76.4% Fibonacci retracement level of the recent upward move (from $2,148 to $2,275). Crucially, the $2,150 level, which aligns with the 100-hourly Simple Moving Average, represents a robust support zone. This area is critical for maintaining the current bullish structure.
However, a break below $2,150 could signal a shift in momentum, potentially leading to a steady decline. If this level fails to hold, the next support to monitor is at $2,080, followed by $2,020 in the near term. Therefore, while the current outlook is bullish, keeping an eye on these support levels is crucial for traders.
Decoding Technical Indicators for ETH
Let’s examine the technical indicators to get a clearer picture of Ethereum’s current market condition:
- Hourly MACD (Moving Average Convergence Divergence): The MACD for ETH/USD is currently showing a decrease in bullish momentum. While still in the bullish zone, the fading momentum suggests potential consolidation or a minor pullback before the next move up.
- Hourly RSI (Relative Strength Index): The RSI for ETH/USD remains above the 50 level. This indicates that buying momentum is still present, although not in overbought territory, suggesting room for further upward movement.
Key Levels to Watch:
- Major Support Level: $2,175
- Major Resistance Level: $2,250
Ethereum’s Path Forward: Bullish Momentum or Consolidation?
In conclusion, Ethereum is currently exhibiting strong bullish momentum, having successfully surpassed the $2,200 mark. The immediate target is to overcome the $2,250 and $2,275 resistance levels to pave the way towards $2,500. While technical indicators suggest a slight decrease in bullish momentum in the short term, the overall outlook remains positive as long as ETH holds above key support levels, particularly $2,150. Keep a close watch on these levels as Ethereum navigates its path in the dynamic crypto market. Will ETH reach $2,500? The coming days will be crucial in determining the next major move!
Disclaimer: The information provided is not trading advice, Bitcoinworld.co.in holds no liability for any investments made based on the information provided on this page. We strongly recommend independent research and/or consultation with a qualified professional before making any investment decisions.