The GBP/USD currency pair continues its upward grind in London trading today, yet the formidable 1.3450 resistance level refuses to yield to bullish pressure, creating a critical technical battleground for forex traders worldwide. This persistent struggle represents more than just a number on a chart; it encapsulates the ongoing tension between British economic resilience and global dollar dynamics. Market participants now watch this level with intense scrutiny, as a decisive break could signal the next major directional move for the Sterling-Dollar pair.
Technical Analysis of GBP/USD at 1.3450
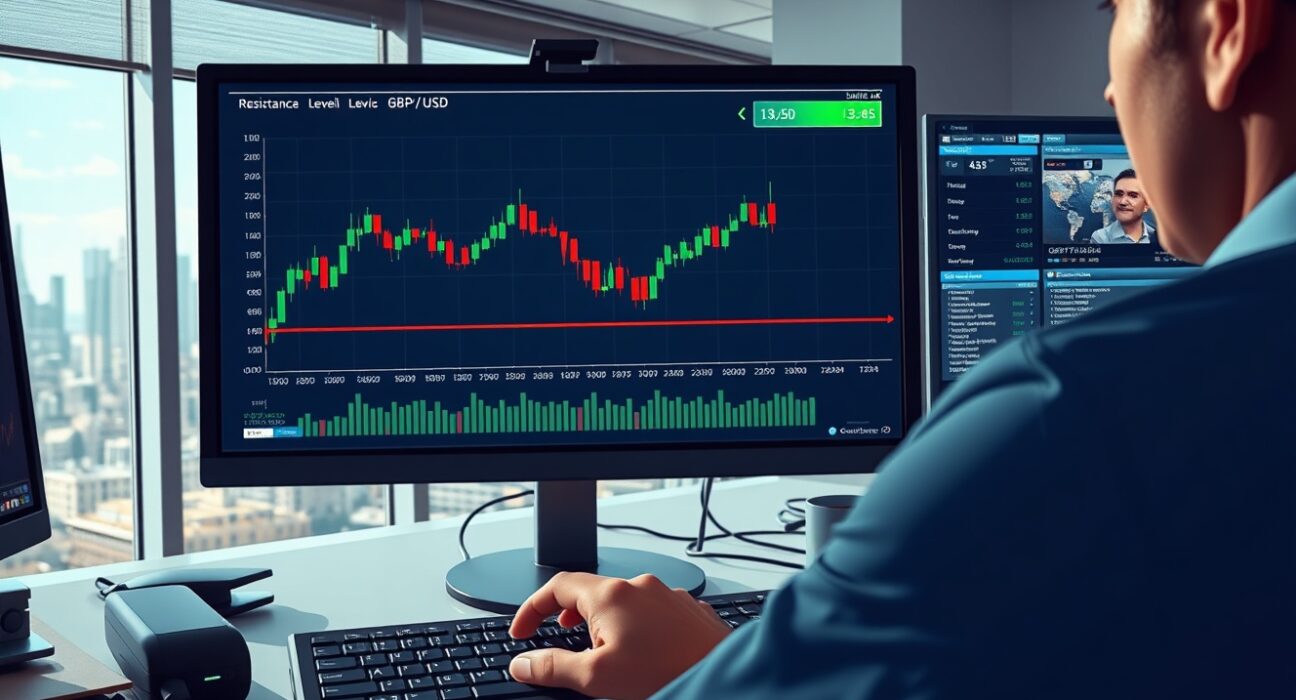
Technical analysts identify the 1.3450 level as a multi-layered resistance zone with significant historical importance. This price point previously acted as both support and resistance throughout 2023 and early 2024, creating what chartists call a “memory level” where market participants maintain strong psychological associations. The current price action shows the pair testing this barrier for the third consecutive week, with each attempt resulting in rejection and subsequent consolidation. Furthermore, the 200-day moving average converges near this level, adding another technical dimension to the resistance.
Several key technical indicators provide context for the current standoff:
- Relative Strength Index (RSI): Currently reading 58, suggesting moderate bullish momentum without overbought conditions
- Moving Average Convergence Divergence (MACD): Shows bullish crossover but weakening histogram bars
- Bollinger Bands: Price trading near upper band, indicating stretched conditions
- Volume Profile: Shows significant trading activity previously occurred around 1.3450
Fundamental Drivers Behind the Sterling-Dollar Dance
The fundamental backdrop provides crucial context for understanding why 1.3450 represents such a formidable barrier. On the British side, the Bank of England maintains a relatively hawkish stance compared to other major central banks, with inflation concerns continuing to influence monetary policy decisions. Recent economic data shows mixed signals, however, with services sector strength offset by manufacturing weakness. Meanwhile, the US dollar finds support from Federal Reserve policy expectations and its traditional safe-haven status during periods of global uncertainty.
Comparative economic indicators reveal the underlying dynamics:
| Indicator | United Kingdom | United States |
|---|---|---|
| Core Inflation | 3.2% | 2.8% |
| Central Bank Rate | 4.75% | 5.25% |
| GDP Growth (QoQ) | 0.2% | 0.4% |
| Unemployment Rate | 4.3% | 3.9% |
Expert Perspectives on the Technical Standoff
Financial institutions and independent analysts offer varied interpretations of the current technical impasse. JPMorgan’s currency strategy team notes that “the 1.3450 level represents not just technical resistance but also reflects options market positioning, with significant barrier options expiring at this level throughout the quarter.” Meanwhile, Bloomberg Intelligence analysts observe that “sterling’s inability to breach this level despite favorable interest rate differentials suggests underlying structural concerns about UK economic prospects.” These expert views highlight how technical levels often concentrate multiple market forces and participant expectations.
Historical Context and Pattern Recognition
The current price action finds precedent in historical GBP/USD behavior. During the post-Brexit period, similar technical standoffs occurred at round-number levels, with the pair often consolidating for extended periods before making decisive moves. The 1.3500 level, just 50 pips above current resistance, previously acted as major resistance throughout 2021 before finally giving way in early 2022. This historical pattern suggests that while resistance levels eventually break, the process often involves multiple tests and considerable patience from market participants.
Several historical parallels provide context for current market behavior:
- 2016 Post-Brexit: 1.3500 acted as resistance for 8 months before breaking
- 2020 Pandemic Recovery: 1.3400-1.3500 range contained price for 5 months
- 2022 Dollar Peak: 1.1450 support held through 7 monthly tests
Market Sentiment and Positioning Data
Commitment of Traders (COT) reports from the Commodity Futures Trading Commission reveal evolving market positioning around the current technical level. Non-commercial traders, typically hedge funds and large speculators, have gradually increased their net long sterling positions over the past month, though positioning remains well below extreme levels. Commercial traders, including multinational corporations conducting legitimate business hedging, show more balanced exposure. This positioning data suggests that while speculative interest supports sterling, it hasn’t reached the crowded levels that often precede sharp reversals.
The Impact of Global Macroeconomic Developments
Global macroeconomic developments increasingly influence the GBP/USD pair’s ability to overcome technical barriers. European Central Bank policy decisions affect sterling through the EUR/GBP cross rate, while commodity price movements, particularly energy prices, impact the UK’s terms of trade. Additionally, geopolitical developments continue to drive safe-haven flows into the US dollar, creating headwinds for any sustained sterling appreciation. These interconnected factors mean the 1.3450 resistance represents more than just a technical level; it serves as a barometer for multiple global economic relationships.
Potential Scenarios and Risk Management Considerations
Traders and investors currently prepare for several potential outcomes as the GBP/USD pair approaches this critical juncture. A decisive break above 1.3450, confirmed by daily closing prices and increased volume, could open the path toward 1.3600 initially, with 1.3800 representing the next major resistance zone. Conversely, rejection from current levels might see the pair retest support around 1.3300, with 1.3200 representing stronger support. Risk management professionals emphasize the importance of position sizing and stop-loss placement during such technically significant periods, as false breaks and whipsaw action frequently occur around major levels.
Conclusion
The GBP/USD pair’s ongoing struggle with the 1.3450 resistance level encapsulates the current state of global currency markets, where technical barriers concentrate fundamental forces and market psychology. This level’s persistence despite upward grinding reflects the balanced tension between British economic factors and US dollar dynamics. As traders monitor this critical juncture, the eventual resolution will likely signal the next significant directional move for the sterling-dollar exchange rate, with implications for international trade, investment flows, and economic policy on both sides of the Atlantic. The 1.3450 resistance thus represents more than a technical level; it serves as a focal point for broader market narratives about relative economic performance and monetary policy divergence.
FAQs
Q1: Why is 1.3450 such an important level for GBP/USD?
The 1.3450 level represents a key technical resistance zone with historical significance, having previously acted as both support and resistance. It also converges with the 200-day moving average and represents a psychological round number that attracts options market activity and trader attention.
Q2: What fundamental factors support sterling near current levels?
The Bank of England maintains a relatively hawkish monetary policy stance compared to other central banks, with interest rates at 4.75%. Additionally, services sector strength and declining though persistent inflation provide underlying support for the currency.
Q3: What would constitute a decisive break above 1.3450?
A decisive break typically requires the pair to close above 1.3450 on a daily basis with increased trading volume, followed by successful retests of the level as support. Many traders wait for a weekly close above the level for confirmation.
Q4: How do US economic factors influence this technical level?
Federal Reserve policy expectations, US economic data relative to other economies, and the dollar’s safe-haven status during global uncertainty all influence whether GBP/USD can overcome technical resistance. Strong US data typically strengthens resistance levels.
Q5: What historical patterns suggest about the current standoff?
Historical analysis shows that GBP/USD often tests major technical levels multiple times before breaking through. The 1.3500 level previously required 8 months of testing before breaking in 2022, suggesting patience may be required for the current resistance.
Disclaimer: The information provided is not trading advice, Bitcoinworld.co.in holds no liability for any investments made based on the information provided on this page. We strongly recommend independent research and/or consultation with a qualified professional before making any investment decisions.