Bitcoin, the king of cryptocurrencies, has seen its price fluctuate quite a bit recently. After reaching a new all-time high, it’s now facing some downward pressure. Crypto analytics firm Glassnode has recently pointed out a potentially bearish signal based on their on-chain data analysis. Let’s dive into what this means for Bitcoin and what could be influencing its price.
Decoding Glassnode’s Bearish Bitcoin Indicator
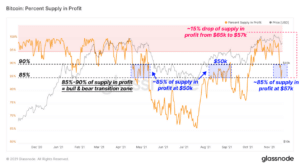
According to Glassnode, a significant portion of Bitcoin’s circulating supply is currently held at a cost basis higher than the current market price. Specifically, they highlight that 15% of the Bitcoin supply was last moved on-chain when the price was above $57,000. With Bitcoin currently trading around $57,377 (at the time of writing), and having experienced a 4.5% dip from last week and a 17% drop from its all-time high, this observation becomes particularly relevant.
But why is this considered a bearish signal? Let’s break it down:
- Underwater Supply: When a substantial amount of Bitcoin is held by investors who bought it at a higher price (meaning they are currently ‘underwater’ or at a loss), it can create selling pressure. These holders might be more inclined to sell if the price recovers to their entry point, just to break even or minimize losses.
- Resistance Levels: This ‘overhead supply’ at higher price levels can act as resistance. As Bitcoin tries to climb back up, it might encounter selling pressure from these underwater holders, making it harder to sustain upward momentum.
- Historical Context: Glassnode notes that historically, a 15% underwater supply has been enough to trigger reflexive downside. This means that if the price fails to recover quickly, the selling pressure could intensify, pushing the price further down.

Understanding UTXO Realized Price Distribution (URPD)
To further support their analysis, Glassnode uses a metric called UTXO Realized Price Distribution (URPD). This might sound technical, but it’s a valuable tool for understanding Bitcoin’s market structure. Let’s simplify what URPD tells us:
Imagine you’re looking at a map of Bitcoin transactions. URPD essentially shows you at what price levels different portions of the current Bitcoin supply were last moved on the blockchain. Think of it as a price heatmap for Bitcoin’s supply. Each bar in a URPD chart represents a price range, and the height of the bar indicates the amount of Bitcoin that last moved within that price range.
In simpler terms:
- Price Buckets: URPD divides Bitcoin’s price history into ‘buckets’ or ranges.
- Supply Movement: It tracks when Bitcoin transactions occurred within each price bucket.
- Current Picture: By analyzing URPD, we get a snapshot of where the current Bitcoin supply was last active in terms of price.
This helps analysts identify key price levels where a lot of Bitcoin changed hands, which can indicate areas of potential support or resistance.

Key Price Clusters and Potential Resistance Ahead
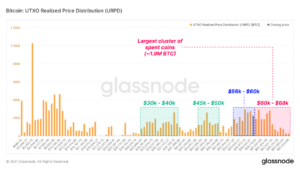
Glassnode’s URPD analysis reveals some interesting clusters of Bitcoin transactions from throughout 2021. Notably, they point out that a significant 1.9 million BTC were moved within the price range of $60,000 to $68,000. This is a massive amount of Bitcoin that changed hands at these higher prices.
What does this mean for Bitcoin’s future price action?
- Overhead Supply: The large volume of Bitcoin acquired between $60k and $68k represents a substantial ‘overhead supply’. These holders, now potentially underwater, might be looking to sell if the price revisits these levels.
- Resistance in Coming Weeks: Glassnode suggests that this overhead supply could act as a significant resistance level in the coming weeks. If Bitcoin attempts to rally, it might face strong selling pressure as it approaches this price range.
- Holder Behavior: The behavior of these underwater holders will be crucial. If they decide to cut their losses and sell, it could further dampen any potential price recovery.
In essence, the analysis suggests that Bitcoin might face headwinds in the short to medium term due to this overhead supply and the potential for increased selling pressure from underwater holders.
What’s Next for Bitcoin?
Glassnode’s analysis provides valuable insights into the current market dynamics of Bitcoin. While it highlights a potential bearish signal, it’s important to remember that the crypto market is highly volatile and influenced by numerous factors.
Key Takeaways:
- Monitor Price Action: Keep a close eye on Bitcoin’s price movement. Will it be able to reclaim higher levels and break through the resistance around $60k-$68k?
- UTXO and On-Chain Data: Pay attention to on-chain metrics like URPD for a deeper understanding of market structure and potential price movements. Glassnode and other analytics firms offer valuable tools and data.
- Market Sentiment: Consider overall market sentiment and broader economic factors that could influence Bitcoin’s price.
While the Glassnode data suggests caution, it’s crucial to conduct your own research and consider various perspectives before making any investment decisions. The crypto market is ever-evolving, and staying informed is key to navigating its complexities.
Galaxy Interactive Rises Additional $325M Fund For Metaverse and Next Gen…>>

Related Posts – Bank DBS’s Crypto Business Grows Massively Due To Growing Demand From Investors
Disclaimer: The information provided is not trading advice, Bitcoinworld.co.in holds no liability for any investments made based on the information provided on this page. We strongly recommend independent research and/or consultation with a qualified professional before making any investment decisions.


