
As 2023 nears its end, the crypto market is buzzing with activity, and two tokens in particular, Chainlink (LINK) and Maker (MKR), are capturing significant investor attention. New wallets are popping up, accumulating these tokens, sparking speculation about potential price surges. Could this increased buying pressure signal the start of a new rally for LINK and MKR? Let’s delve into the data and market indicators to find out!
Investor Interest in Chainlink (LINK) and Maker (MKR) Heats Up
Recent on-chain data reveals a notable trend: fresh wallets are actively accumulating both LINK and MKR. This accumulation phase often precedes price appreciation, as increased demand can drive prices upwards. Are whales leading the charge?
- Fresh Accumulation: New wallets are showing a strong interest in acquiring LINK and MKR.
- Whale Activity: Lookonchain reported significant MKR withdrawals by whale wallets, indicating strong conviction from large holders.
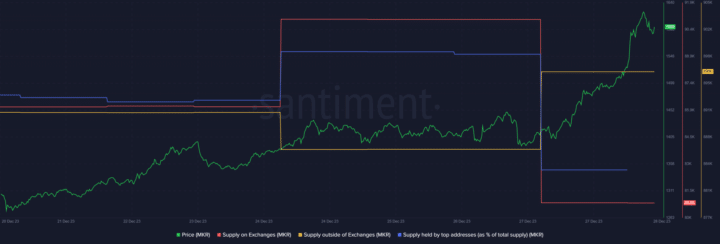
- Supply Dynamics: Santiment data confirms a decrease in LINK and MKR supply on exchanges, coupled with an increase in supply outside exchanges. This suggests investors are moving tokens into private wallets, a bullish signal.
See Also: Bitcoin SV (BSV) Price Soars 63% In 24 hours, Hits YTD High
Buying Pressure on Chainlink and Maker Rises: What Does It Mean?
On December 27th, crypto analytics platform Lookonchain highlighted significant movements in LINK and MKR. Large whale wallets were observed withdrawing substantial amounts of MKR from exchanges. For instance, wallet 0xE68E alone withdrew 3,150 MKR, valued at over $4.5 million! Another wallet moved 136,146 MKR, worth more than $2 million.
Whales are accumulating $MKR and $LINK.
A whale withdrew 3,150 $MKR($4.5M) from #Binance again 2 hours ago.
And another whale withdrew 136,146 $LINK($2M) from #Binance 4 hours ago.
Whales are so bullish on $MKR and $LINK? pic.twitter.com/r7YgM9k2iL
— Lookonchain (@lookonchain) December 27, 2023
To get a broader picture of investor sentiment, we turned to Santiment data. The analysis revealed a compelling trend for both tokens:
- LINK Supply Dynamics: A decrease in LINK supply on exchanges alongside an increase in supply outside of exchanges indicates growing accumulation and potentially less selling pressure. Surprisingly, the supply held by top addresses remained stable, suggesting a wider distribution of accumulation.
- MKR Supply Dynamics: MKR mirrored this trend, showing a significant drop in exchange supply and a surge in supply held outside exchanges on December 27th. This points to active buying and investors moving MKR into their own custody. Whale confidence in MKR also saw an initial increase, evidenced by a rise in supply held by top addresses, although this slightly decreased afterwards.

See Also: How To Prevent Transaction Fees From Eating Into Your Crypto Trading Profits
Will This Buying Pressure Translate to Price Gains?
Now, the crucial question: Will this increased buying activity lead to positive price movements for LINK and MKR? To assess this, let’s examine their daily charts and key technical indicators.
Chainlink (LINK) – Mixed Signals
Analyzing Chainlink’s daily chart reveals a mixed bag of signals:
- Bullish Indicators:
- MACD Crossover: The Moving Average Convergence Divergence (MACD) indicates a bullish crossover, suggesting potential upward momentum.
- Bollinger Bands: Bollinger Bands suggest LINK’s price is entering a volatile zone, which, in this context, appears to be leaning bullish based on the MACD.
- Bearish Indicators:
- Relative Strength Index (RSI): The RSI is showing a downtick, potentially indicating overbought conditions or weakening momentum.
- Chaikin Money Flow (CMF): Similarly, the CMF is also trending downwards, suggesting a decrease in buying pressure in the short term.
Despite these mixed signals, LINK has shown strong performance recently, surging by over 12% in the last 24 hours. At the time of writing, LINK is trading at $15.95.
Maker (MKR) – Bullish Momentum Building
Maker (MKR) presents a more consistently bullish picture based on technical indicators:
- Bullish Indicators:
- MACD: Similar to LINK, MKR’s MACD also displays a bullish upper hand, reinforcing the positive momentum.
- Bollinger Bands: Bollinger Bands for MKR also indicate an optimistic outlook, suggesting potential for price expansion.
- RSI & CMF: Both the RSI and CMF are trending upwards, confirming increasing buying strength and positive momentum.
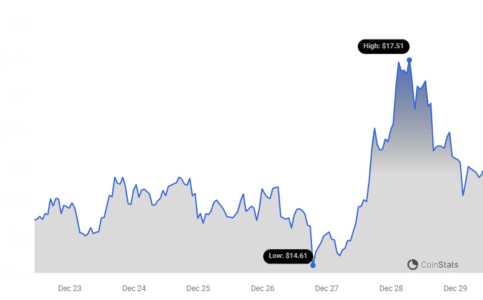
MKR has also experienced positive price action, up by 2% in the last 24 hours. Currently, MKR is trading around $1,547, boasting a market capitalization exceeding $1.4 billion.
 Maker Price Chart | Source: Coinstats[/caption>
In Conclusion: A Glimmer of Hope for LINK and Strong Bullish Signals for MKR
Both Chainlink and Maker are witnessing increased investor interest, evident from rising accumulation and positive on-chain metrics. While Chainlink’s technical indicators present a mixed picture, suggesting potential short-term volatility, the recent price surge and bullish MACD crossover offer a glimmer of hope for further gains. Maker, on the other hand, showcases stronger bullish signals across multiple indicators, suggesting a higher probability of a price uptick.
Keep a close watch on these tokens as we head into the new year. The increased buying pressure could indeed be the catalyst for a new rally, particularly for MKR, which exhibits more robust bullish momentum.
Disclaimer: The information provided is not trading advice. Bitcoinworld.co.in holds no liability for any investments made based on the information provided on this page. We strongly recommend independent research and/or consultation with a qualified professional before making any investment decisions.
Disclaimer: The information provided is not trading advice, Bitcoinworld.co.in holds no liability for any investments made based on the information provided on this page. We strongly recommend independent research and/or consultation with a qualified professional before making any investment decisions.