Navigating the volatile world of cryptocurrency can feel like riding a rollercoaster. Just when you think you’ve got a handle on the market trends, a sudden surge or dip throws everything into question. Recently, Kaspa (KAS), a notable player in the crypto space, has demonstrated this very unpredictability. After a week of downward pressure, KAS has shown a positive shift in the last 24 hours. Let’s dive into the latest price movements of Kaspa and understand what these shifts could mean for investors and enthusiasts.
Kaspa (KAS) Bounces Back: A 24-Hour Price Surge
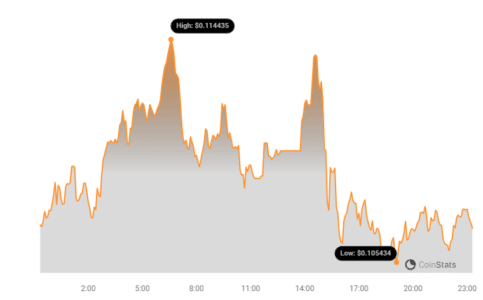
In a welcome turn for Kaspa holders, the price of KAS has increased by 4.26% over the last day. This positive movement pushes the price to $0.11 as of today.

This upward tick is particularly noteworthy when viewed against the backdrop of the past week’s performance. Kaspa experienced a 9.0% decrease over the last seven days, falling from $0.12. This recent 24-hour surge could indicate a potential shift in momentum, but is it enough to signal a full recovery? Currently, Kaspa remains below its all-time high of $0.15, leaving room for growth and potential future gains.
See Also: The UK FCA Sets To Oversee Crypto Sandbox In Jan. 8 2024
Daily vs. Weekly Price Action: Understanding Kaspa’s Volatility
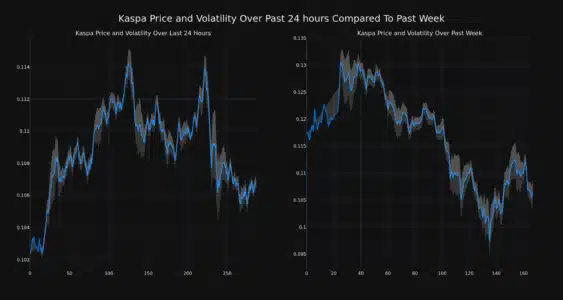
To better grasp Kaspa’s recent behavior, it’s crucial to compare its daily and weekly price movements. The charts below provide a visual representation of this, highlighting the volatility experienced by KAS in different time frames.
The left chart focuses on the past 24 hours, showcasing the recent price increase. Conversely, the chart on the right broadens the scope to the last week, illustrating the preceding negative trend.

Bollinger Bands, represented by the gray bands in the charts, are a valuable tool for understanding volatility. These bands measure price fluctuations around a moving average.
- Wider Bands = Higher Volatility: When the Bollinger Bands widen, it indicates increased price volatility. The larger the gray area, the more significant the price swings are within that period.
- Narrower Bands = Lower Volatility: Conversely, narrow bands suggest a period of relative price stability.
By examining the Bollinger Bands in both the daily and weekly charts, we can visually assess the shifts in Kaspa’s price volatility over these different timeframes.
Trading Volume and Circulating Supply: Key Indicators for Kaspa
Beyond price movements, two other critical metrics offer insights into Kaspa’s market dynamics: trading volume and circulating supply.
- Trading Volume Surge: Interestingly, despite the weekly price dip, Kaspa’s trading volume has increased by 20.0% over the past week. This surge in trading activity could suggest renewed interest in KAS, potentially foreshadowing further price movements.
- Circulating Supply Growth: The circulating supply of KAS has also seen a slight increase of 0.33% in the last week. Currently, over 21.98 billion KAS coins are in circulation.
This circulating supply represents a significant portion of Kaspa’s total max supply.

Let’s break down the supply figures:
| Metric | Value |
|---|---|
| Circulating Supply | 21.98 Billion KAS |
| Percentage of Max Supply | 76.59% (estimated) |
| Max Supply | 28.70 Billion KAS |
The fact that over 76% of the maximum Kaspa supply is already circulating can influence scarcity and potentially future price action as demand fluctuates.
Kaspa’s Market Cap and Ranking
Currently, Kaspa holds the #39 rank in the cryptocurrency market capitalization. Its market cap stands at $2.34 billion. This ranking and market cap place Kaspa firmly within the mid-tier range of cryptocurrencies, indicating a substantial market presence and investor interest.
What Does This Mean for Kaspa’s Future?
Kaspa’s recent 24-hour price surge is a positive sign, especially after a week of negative price movement. The increased trading volume further suggests growing interest in KAS. However, it’s crucial to remember that the cryptocurrency market is inherently volatile. While this recent uptick could be the start of a recovery, sustained positive momentum is needed to confirm a trend reversal. Investors should continue to monitor Kaspa’s price action, trading volume, and broader market conditions to make informed decisions.
Disclaimer: The information provided is not trading advice. Bitcoinworld.co.in holds no liability for any investments made based on the information provided on this page. We strongly recommend independent research and/or consultation with a qualified professional before making any investment decisions.
Disclaimer: The information provided is not trading advice, Bitcoinworld.co.in holds no liability for any investments made based on the information provided on this page. We strongly recommend independent research and/or consultation with a qualified professional before making any investment decisions.


