
Litecoin (LTC) has been showing resilience, maintaining gains above the critical $82.00 support level against the US Dollar. But can this stability translate into a sustained bullish run? Let’s dive into a detailed analysis of Litecoin’s current price action, key technical indicators, and potential future movements.
Litecoin (LTC) Price Holding Steady: What’s Next?
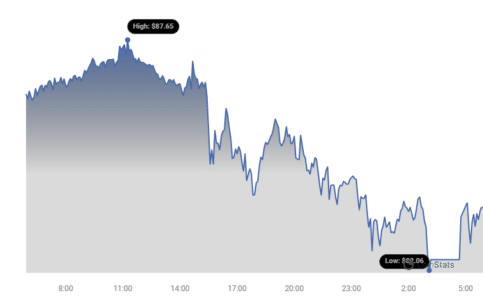
Litecoin’s ability to hold above $82.00 is a positive sign. The price is currently trading above this level and the 55-period simple moving average on the 4-hour chart. This suggests underlying strength and potential for further upward movement. However, the presence of a rising channel with resistance near $88.50 on the 4-hour chart of the LTC/USD pair (data from Coinbase) indicates that the bulls need to overcome this hurdle to establish a stronger uptrend.
Key Observations:
- Current Price: Above $82.00
- Moving Average: Above the 55 simple moving average (4-hour chart)
- Resistance: Rising channel resistance near $88.50
- Potential: Bullish momentum possible above $88.50 and $92.50
Litecoin Price Analysis: A Closer Look
Recently, Litecoin, along with other major cryptocurrencies like Bitcoin and Ethereum, experienced range-bound movements. After struggling to break the $106 resistance zone, LTC faced a decline. However, the bulls stepped in to defend the crucial $70.00 support, preventing a deeper correction.
Following a low near $70.83, Litecoin is now attempting a fresh increase, breaking above the $80 level and the 23.6% Fib retracement level of the move from $106.00 to $70.80. This recovery suggests renewed buying interest and a potential shift in momentum.
See Also: BNB Price Reclaims $600 and Bulls Could Now Aim For New 2024 High
What are the Key Resistance Levels to Watch?
The immediate resistance lies near $88.50, coinciding with the 50% Fib retracement level and the upper boundary of the rising channel. A successful breakout above this level could pave the way for a move towards $92.50. Clearing $92.50 could trigger a rally towards the psychological $100 zone, with the next major resistance at $106. Further gains could potentially propel Litecoin towards $120.
What if Litecoin Fails to Break Higher?
On the downside, the initial support is around $82.00, followed by $80.00. A break below $80.00 could lead to a sharper decline towards the $70.00 level in the short term. It’s crucial to monitor these support levels to gauge the potential for further downside risk.
Technical Indicators: A Deeper Dive
Let’s examine the key technical indicators to gain further insights into Litecoin’s current market condition:
- 4-hour MACD: Gaining pace in the bearish zone, suggesting potential selling pressure.
- 4-hour RSI: Below the 50 level, indicating neutral to bearish momentum.
Key Levels at a Glance:
| Level Type | Price |
|---|---|
| Key Support 1 | $82.00 |
| Key Support 2 | $80.00 |
| Key Resistance 1 | $88.50 |
| Key Resistance 2 | $92.50 |
In Conclusion: Is Litecoin Poised for a Bullish Breakout?
Litecoin’s price is currently at a critical juncture. While holding above $82.00 is encouraging, the cryptocurrency needs to overcome the $88.50 and $92.50 resistance levels to confirm a bullish breakout. Traders and investors should closely monitor these levels and consider the technical indicators to make informed decisions. The MACD and RSI suggest some caution, but a clear break above resistance could signal a strong buying opportunity.
Technical Indicators
- 4 hours MACD – The MACD for LTC/USD is now gaining pace in the bearish zone.
- 4 hours RSI (Relative Strength Index) – The RSI for LTC/USD is now below the 50 level.
- Key Support Levels – $82.00 and $80.00.
- Key Resistance Levels – $88.50 and $92.50.
Disclaimer: The information provided is not trading advice. Bitcoinworld.co.in holds no liability for any investments made based on the information provided on this page. We strongly recommend independent research and/or consultation with a qualified professional before making any investment decisions.
#Binance #WRITE2EARN
Disclaimer: The information provided is not trading advice, Bitcoinworld.co.in holds no liability for any investments made based on the information provided on this page. We strongly recommend independent research and/or consultation with a qualified professional before making any investment decisions.