Navigating the choppy waters of the crypto market can feel like deciphering ancient runes, especially when you’re trying to pinpoint the next potential mover. Today, we’re diving deep into Optimism (OP), a Layer-2 scaling solution for Ethereum, to unpack its recent price action and what it might signal for the future. Is OP showing signs of strength, or is this just a fleeting moment of optimism? Let’s break down the latest data.
Optimism (OP) Price Action: A Glimmer of Green Amidst a Week of Red?
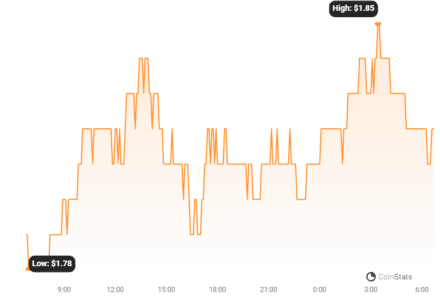
In the whirlwind 24-hour crypto cycle, Optimism (OP) has flashed a signal of resilience. The price of OP has ticked upwards by 4.28%, currently sitting at $1.85. This is a welcome change for OP holders, especially considering the slightly bearish sentiment that has dominated the past week. Looking back over the last seven days, OP experienced a minor dip of 1.0%, starting from $1.85. While a small decrease, it’s important to acknowledge this broader trend to understand the context of today’s positive movement.
To put things in perspective, OP is still trading below its all-time high of $3.22. Reaching and surpassing this peak remains a key target for bulls. But what’s driving this recent uptick, and is it sustainable?
Decoding Volatility: Are Bollinger Bands Telling a Story?
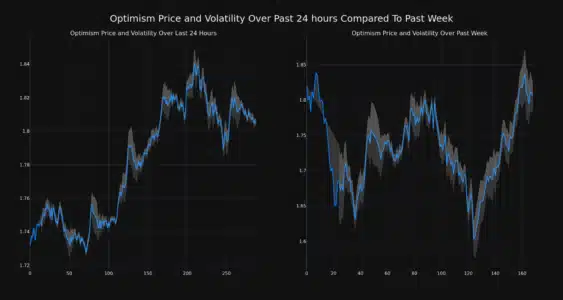
Volatility is the heartbeat of the crypto market. Understanding it is crucial for making informed decisions. Let’s examine the volatility of Optimism using Bollinger Bands, a popular technical analysis tool. These bands help us visualize price fluctuations over time.
The chart below provides a visual comparison of OP’s price movement and volatility:
- Left Chart (24 Hours): This shows the daily price movement and volatility.
- Right Chart (Past Week): This illustrates the weekly price movement and volatility.
The gray bands you see are the Bollinger Bands. Essentially, they measure how much the price of OP is moving around its average price. The wider these bands are, the higher the volatility. A large gray area indicates significant price swings, while narrower bands suggest more stable price action.
See Also: Ankr and Optimism Unite for Ethereum App Scaling
Want to dive deeper into Optimism’s ecosystem? Check out the related article above to learn about the exciting partnership between Ankr and Optimism, aimed at scaling Ethereum applications. This kind of fundamental development can often influence price movements in the long run.
Trading Volume and Circulating Supply: What’s the Bigger Picture?
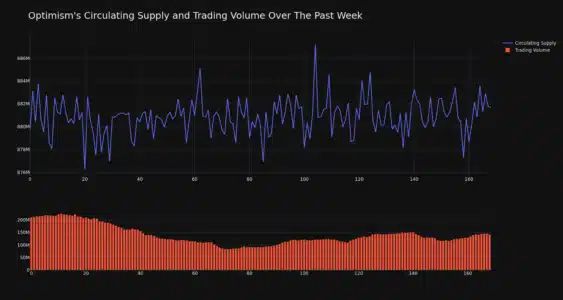
Beyond price and volatility, let’s explore other key metrics that can provide a more complete picture of Optimism’s market health:
- Trading Volume: This indicates the level of buying and selling activity for OP. A decrease in trading volume, as seen with a 33.0% reduction over the past week, could suggest waning interest or consolidation in the market. However, it’s crucial to analyze this in conjunction with price action.
- Circulating Supply: This refers to the number of OP coins currently in circulation and available to trade. The circulating supply has slightly increased by 0.24% over the past week, now exceeding 880.92 million coins.
- Supply Dynamics: Currently, the circulating supply represents approximately 20.51% of OP’s maximum supply of 4.29 billion. Understanding the tokenomics and release schedule of a cryptocurrency is vital for long-term investment considerations. As more tokens are released into circulation, it can impact price dynamics.
Why does circulating supply matter? Imagine a pie being divided. If the pie (total supply) is fixed, and the number of slices (circulating supply) increases, each slice might become slightly smaller (potentially diluting the value per coin, if demand remains constant). However, a strategic and gradual release of tokens can also foster wider distribution and network growth.
Market Cap and Ranking: Where Does Optimism Stand?
Optimism currently holds the #41 rank in market capitalization, with a market cap of $1.59 billion. Market cap is calculated by multiplying the current price by the circulating supply. It’s a useful metric for comparing the relative size and dominance of different cryptocurrencies.
A ranking of #41 places Optimism firmly within the top tier of cryptocurrencies, indicating significant market recognition and adoption. However, rankings can fluctuate, and it’s essential to monitor OP’s performance relative to its peers in the Layer-2 scaling solutions space and the broader crypto market.
Optimism: A Layer-2 Solution with Potential
For those new to the crypto space, Optimism is a Layer-2 scaling solution built on top of the Ethereum blockchain. Think of it as an express lane for Ethereum transactions. Layer-2 solutions like Optimism aim to address Ethereum’s scalability challenges by processing transactions off the main Ethereum chain, making transactions faster and cheaper while still benefiting from Ethereum’s security.
Key benefits of Optimism and Layer-2 solutions in general include:
- Reduced Gas Fees: Significantly lower transaction costs compared to mainnet Ethereum.
- Faster Transactions: Improved transaction speeds, making decentralized applications (dApps) more user-friendly.
- Ethereum Compatibility: Built to be compatible with Ethereum, allowing for easy migration of dApps.
- Scalability: Enhancing Ethereum’s ability to handle a larger volume of transactions, crucial for mass adoption.
As the Ethereum ecosystem continues to grow, Layer-2 solutions like Optimism are poised to play a critical role in its scalability and overall success.
Concluding Thoughts: Is Optimism’s Optimism Justified?
Optimism (OP) has shown a short burst of positive price movement, offering a glimmer of hope after a week of slight decline. However, the decrease in trading volume warrants attention. While the circulating supply is gradually increasing, understanding the tokenomics and long-term roadmap of Optimism is crucial for investors.
Optimism’s position as a leading Layer-2 scaling solution for Ethereum provides a strong fundamental basis for its potential. The recent price uptick could be a sign of renewed interest, but sustained upward momentum will likely depend on broader market sentiment, continued development within the Optimism ecosystem, and increasing adoption of Layer-2 solutions.
Actionable Insights for Crypto Enthusiasts:
- Monitor Volatility: Keep an eye on Bollinger Bands and other volatility indicators to understand potential price swings.
- Track Trading Volume: Changes in trading volume can provide clues about market interest and potential trend shifts.
- Stay Informed on Fundamentals: Follow developments within the Optimism ecosystem, partnerships, and adoption metrics.
- Consider Layer-2 Growth: The long-term success of Layer-2 solutions is intertwined with Ethereum’s growth. Understanding this space is key to navigating the evolving crypto landscape.
Ultimately, the crypto market is dynamic and unpredictable. While Optimism shows short-term positive signs, thorough research and a balanced perspective are essential before making any investment decisions.
Disclaimer: The information provided is not trading advice. Bitcoinworld.co.in holds no liability for any investments made based on the information provided on this page. We strongly recommend independent research and/or consultation with a qualified professional before making any investment decisions.
Disclaimer: The information provided is not trading advice, Bitcoinworld.co.in holds no liability for any investments made based on the information provided on this page. We strongly recommend independent research and/or consultation with a qualified professional before making any investment decisions.