
Polkadot (DOT) has seen better days. Currently trading with bearish indicators, the question on every trader’s mind is: can DOT hold its ground, or is further decline inevitable? Let’s dive into the critical levels and technical analysis shaping DOT’s price action.
Polkadot’s Price: A Bearish Outlook
Polkadot (DOT) price is currently exhibiting bearish signals, struggling below the $8 resistance mark against the US Dollar. Failure to maintain levels above $6.00 could trigger a more pronounced downward trend.
- DOT is losing momentum below the $8.80 and $8.00 thresholds against the US Dollar.
- The price is navigating below the $7.20 range and the 100 simple moving average (4 hours).
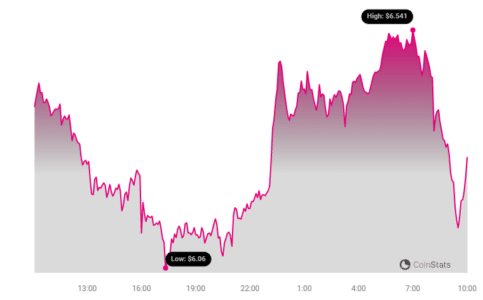
- A significant bearish trend line is emerging, presenting resistance at $6.50 on the 4-hour chart for the DOT/USD pair (data sourced from Kraken).
- The pair may continue its descent toward the $5.00 support area.
Polkadot Price Resumes Drop
Following a period of steady gains, DOT’s price encountered resistance near the $7.60 zone. This led to the formation of a short-term peak and a subsequent decline below the $7.00 level, mirroring trends observed in Ethereum and Bitcoin.
A breakdown occurred below the $6.20 support zone, establishing a low near $6.03, with the price now consolidating losses. It’s making gradual upward movements above the $6.35 level and the 23.6% Fib retracement level, measured from the $7.58 swing high to the $6.03 low.
See Also: Shiba Inu’s Latest Price Projections – Here’s The Move You Should Make
Currently, DOT is trading below the $7.00 zone and the 100 simple moving average (4 hours). Immediate resistance is pinpointed near the $6.50 mark, coinciding with a key bearish trend line on the 4-hour chart for the DOT/USD pair.
The subsequent major resistance lies near $7.00, aligning with the 61.8% Fib retracement level from the $7.58 swing high to the $6.03 low. Surpassing the $7.00 threshold could trigger another robust rally, potentially driving the price toward $8.20 in the short term. The next significant resistance is anticipated near the $10.00 zone.
More Downsides in DOT?
If DOT’s price cannot sustain an upward trajectory beyond $7.00, it risks further decline. The initial crucial support is located near the $6.00 level.
The subsequent major support is near the $5.65 level, breaching which could lead to a drop to $5.00. Further declines might pave the way for a move toward the $4.20 support zone or the trend line.
Technical Indicators
- 4-Hours MACD – The MACD for DOT/USD is losing momentum in the bearish zone.
- 4-Hours RSI (Relative Strength Index) – The RSI for DOT/USD is below the 50 level.
- Major Support Levels – $6.00, $5.65 and $5.00.
- Major Resistance Levels – $6.50, $7.00, and $8.50
Disclaimer: The information provided is not trading advice. Bitcoinworld.co.in holds no liability for any investments made based on the information provided on this page. We strongly recommend independent research and/or consultation with a qualified professional before making any investment decisions.
#Binance #WRITE2EARN
Disclaimer: The information provided is not trading advice, Bitcoinworld.co.in holds no liability for any investments made based on the information provided on this page. We strongly recommend independent research and/or consultation with a qualified professional before making any investment decisions.