

Navigating the volatile crypto market can feel like riding a rollercoaster, and recently, Celestia (TIA) holders have experienced a bit of a dip. Over the past 24 hours, the price of Celestia (TIA) has seen a downturn, falling by 3.82%. Let’s dive into the details of this price movement and understand what’s happening with TIA.
Celestia (TIA) Price Overview: A 24-Hour Snapshot
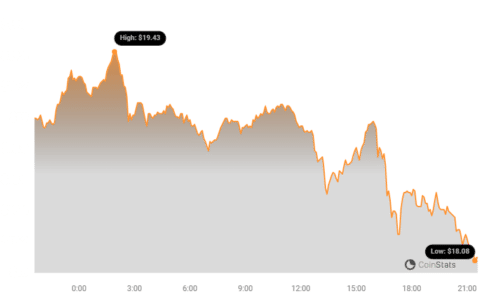
As of now, Celestia (TIA) is trading at $18.4. This marks a 3.82% decrease compared to its price 24 hours ago. This recent dip is part of a larger trend, as TIA has been experiencing negative price action over the past week.
Weekly Downtrend: How Significant is the Drop?
Looking at a broader timeframe, the negative trend for Celestia becomes more apparent. Over the last week, TIA has experienced a significant 10.0% loss in value. The price has moved from $20.36 down to its current level of $18.4. This consistent downward pressure raises questions about the factors influencing TIA’s price.
See Also: Price Analysis: Sei (SEI) Price Increased More Than 9% Within 24 Hours
Volatility Check: Is TIA Experiencing High Price Swings?
To understand the dynamics of TIA’s price movement, it’s crucial to consider volatility. Volatility measures how much the price of an asset fluctuates over time. Higher volatility means more significant and rapid price changes. The chart below provides insights into Celestia’s price movement and volatility over both the past 24 hours and the last week.
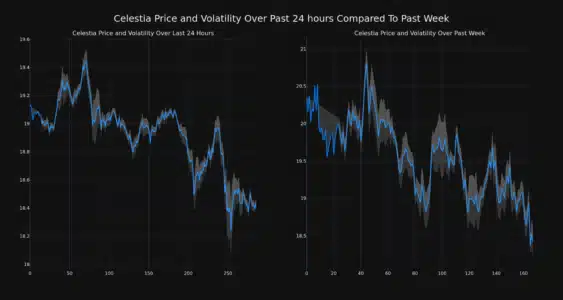
In the charts, the gray bands represent Bollinger Bands. These bands are a popular technical analysis tool used to measure volatility. Essentially, Bollinger Bands help us see how much the price is moving relative to its average.
Key takeaway from Bollinger Bands:
- Wider Bands = Higher Volatility: When the gray bands widen, it indicates increased price fluctuations. A larger gray area at any point signifies higher volatility during that period.
Trading Volume vs. Circulating Supply: What’s the Connection?
Another important aspect to consider is trading volume and circulating supply. Trading volume represents the total amount of TIA coins traded within a specific period, while circulating supply refers to the number of TIA coins currently available in the market.
Interestingly, over the past week, Celestia’s trading volume has decreased by a significant 30.0%. This decrease in trading activity contrasts with the coin’s circulating supply, which has increased by 1.05% during the same period.
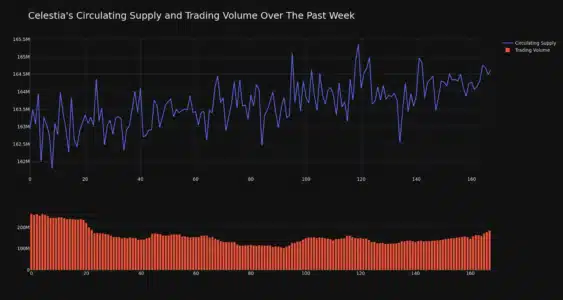
Currently, the circulating supply of TIA stands at 164.50 million coins.
Potential Implications of These Trends:
- Decreasing Trading Volume + Increasing Circulating Supply: This combination could suggest weaker buying pressure in the market. An increase in supply alongside reduced trading interest can sometimes contribute to downward price pressure.
Market Cap and Ranking: Where Does TIA Stand?
According to the latest data, Celestia (TIA) currently holds the #37 rank in market capitalization. Its market cap is valued at $3.03 billion. Market capitalization is a crucial metric as it reflects the total value of a cryptocurrency and its relative size within the broader crypto market.
In Conclusion: Understanding TIA’s Recent Price Action
Celestia (TIA) has experienced a price correction in the last 24 hours and over the past week. The 3.82% daily drop and 10% weekly decline are accompanied by reduced trading volume and an increasing circulating supply. While the Bollinger Bands help visualize volatility, further in-depth analysis is needed to pinpoint the exact reasons behind these price movements. Factors such as overall market sentiment, project-specific news, and broader economic conditions could be influencing TIA’s price.
As always, remember that the cryptocurrency market is inherently volatile. Staying informed and conducting thorough research is essential for making sound investment decisions.
Disclaimer: The information provided is not trading nor financial advice. Bitcoinworld.co.in holds no liability for any trading or investments made based on the information provided on this page. We strongly recommend independent research and/or consultation with a qualified professional before making any trading or investment decisions.
#Binance #WRITE2EARN
Disclaimer: The information provided is not trading advice, Bitcoinworld.co.in holds no liability for any investments made based on the information provided on this page. We strongly recommend independent research and/or consultation with a qualified professional before making any investment decisions.