
Cryptocurrency markets are known for their rollercoaster rides, and today, NEAR Protocol (NEAR) is experiencing a bit of a dip. While the broader crypto space often sees fluctuations, understanding these movements is crucial for investors and enthusiasts alike. So, what’s happening with NEAR Protocol, and is this a temporary setback or something more? Let’s dive into the recent price action and market indicators to get a clearer picture.
NEAR Protocol Price Update: A 24-Hour Snapshot
As of today, NEAR Protocol’s price has decreased by 3.27% in the last 24 hours, bringing it to $3.37. This short-term downturn might raise some eyebrows, especially considering the positive momentum it had built up recently. Take a look at the price chart below to visualize this movement:
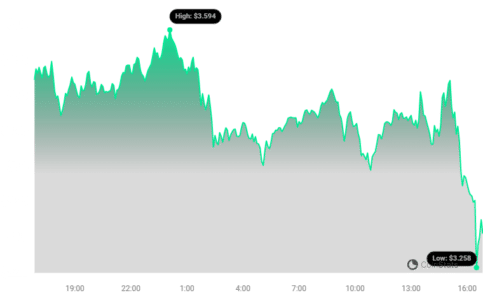
However, before jumping to conclusions about a potential bearish trend, it’s essential to zoom out and look at the bigger picture.
Weekly Performance: A Glimmer of Hope?
Interestingly, when we extend our view to the past week, NEAR Protocol’s performance tells a different story. Over the last seven days, NEAR has actually experienced an upward trend of 5.0%, climbing from $3.22 to its current price. This suggests that while the last 24 hours have been negative, the overall weekly trend is still positive. This contrast highlights the volatile nature of crypto markets and the importance of analyzing trends over different timeframes.
See Also: Price Analysis: Cryptocurrency Optimism (OP) Price Rises More Than 3% In 24 Hours
Volatility Check: Is NEAR Protocol Getting More Unpredictable?
To understand the price movements better, let’s consider volatility. Volatility in crypto refers to the degree of price fluctuations. Higher volatility means prices can swing dramatically in short periods, while lower volatility indicates more stable price action. The chart below uses Bollinger Bands to illustrate NEAR’s volatility over both the last 24 hours and the past week:
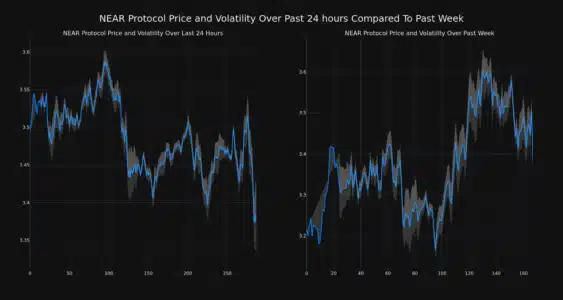
Bollinger Bands, those gray shaded areas in the chart, are a handy tool for measuring volatility. Essentially:
- Wider Bands = Higher Volatility: When the bands widen, it indicates increased price fluctuations.
- Narrower Bands = Lower Volatility: Conversely, narrower bands suggest less price volatility.
By observing the width of these bands, we can gauge how volatile NEAR’s price has been recently. Analyzing both the daily and weekly charts helps us differentiate between short-term price swings and longer-term volatility trends.
Trading Volume and Circulating Supply: What Do They Tell Us?
Beyond price and volatility, other key metrics can provide insights into NEAR’s market dynamics. Let’s look at trading volume and circulating supply.
- Trading Volume: This represents the total amount of NEAR coins traded within a specific period. A decrease in trading volume can sometimes indicate waning interest or market activity.
- Circulating Supply: This refers to the number of NEAR coins currently in circulation and available to the public. Changes in circulating supply can sometimes influence price due to supply and demand dynamics.
According to recent data, NEAR Protocol’s trading volume has decreased by 11.0% over the past week. Interestingly, this decrease in trading volume is occurring alongside a decrease in the circulating supply of NEAR, which has slightly fallen by 0.15%. This relationship is visually represented in the chart below:
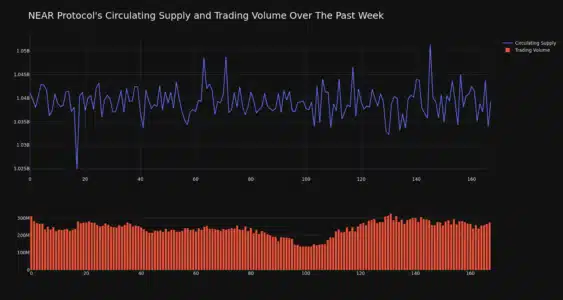
Currently, the circulating supply of NEAR Protocol stands at 1.04 billion coins.
Market Cap and Ranking: Where Does NEAR Stand?
Finally, let’s put NEAR Protocol’s market capitalization and ranking into perspective.
- Market Cap: This is calculated by multiplying the current price of NEAR by its circulating supply. It essentially represents the total market value of NEAR Protocol.
- Market Cap Ranking: This compares NEAR’s market cap to that of other cryptocurrencies, indicating its relative size and dominance in the market.
Currently, NEAR Protocol holds the #35 rank in market capitalization, with a market cap of $3.51 billion. This ranking places NEAR among the top-tier cryptocurrencies, highlighting its significant presence in the crypto ecosystem.
Key Takeaways and Considerations
In summary, while NEAR Protocol has experienced a slight price dip in the last 24 hours, it’s crucial to consider the broader context. Here are some key points to remember:
- Short-Term vs. Long-Term Trends: The 24-hour price decrease contrasts with a positive weekly trend, highlighting the importance of analyzing price movements over different timeframes.
- Volatility is Normal: Cryptocurrency markets are inherently volatile. Price fluctuations, both upward and downward, are part of the game.
- Multiple Indicators Matter: Price is just one piece of the puzzle. Analyzing volatility, trading volume, and circulating supply provides a more comprehensive understanding of market dynamics.
- Market Ranking: NEAR Protocol’s strong market cap ranking indicates its established position within the cryptocurrency space.
Disclaimer: It’s important to remember that this analysis is for informational purposes only and not financial advice. The cryptocurrency market is inherently risky, and past performance is not indicative of future results.
Disclaimer: The information provided is not trading advice. Bitcoinworld.co.in holds no liability for any investments made based on the information provided on this page. We strongly recommend independent research and/or consultation with a qualified professional before making any investment decisions.
#Binance #WRITE2EARN
Disclaimer: The information provided is not trading advice, Bitcoinworld.co.in holds no liability for any investments made based on the information provided on this page. We strongly recommend independent research and/or consultation with a qualified professional before making any investment decisions.