
Cryptocurrency markets are known for their volatility, and Ethereum (ETH), the second-largest cryptocurrency by market capitalization, is no stranger to these fluctuations. However, recent data paints a bullish picture for ETH enthusiasts. Over the last 24 hours, Ethereum has demonstrated a significant upward trend, injecting renewed optimism into the market. Let’s dive into the numbers and analyze what’s driving this price movement.
Ethereum Price Rockets Upward: A 24-Hour Snapshot
In the past day, Ethereum (ETH) has experienced a notable price surge. According to recent data, the price of Ethereum has risen by 4.43%, climbing to $2,619.30. This positive momentum is clearly illustrated in the chart below, showcasing ETH’s price trajectory.
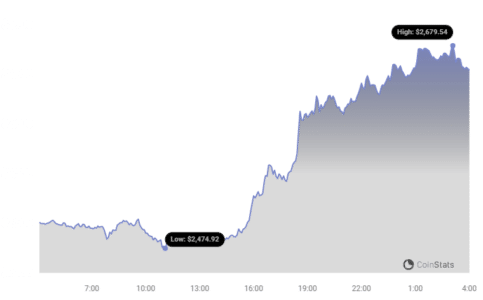
But this isn’t just a one-day wonder. Looking at a broader timeframe, Ethereum’s positive performance extends into the past week.
Weekly Gains: ETH’s Bullish Trend Strengthens
The 24-hour price increase is part of a larger, more encouraging trend. Over the last week, Ethereum (ETH) has demonstrated robust growth, registering an impressive 13.0% gain. This ascent has propelled ETH’s price from $2,297.07 to its current level, solidifying its bullish trajectory. This consistent upward movement suggests growing market confidence in Ethereum.
For context, it’s always helpful to remember past peaks. Currently, Ethereum is still trading below its all-time high of $4,878.26. This historical benchmark serves as a reminder of ETH’s potential and the heights it has previously achieved.
See Also: Price Analysis: Cardano (ADA) Price Rises More Than 3% In 24 Hours
Decoding Volatility: Daily vs. Weekly Price Movements
To understand the nuances of Ethereum’s price action, it’s crucial to consider volatility. Volatility measures the degree of price fluctuations over a period. The chart below provides a comparative view of Ethereum’s price movement and volatility over the past 24 hours (left) and the past week (right).
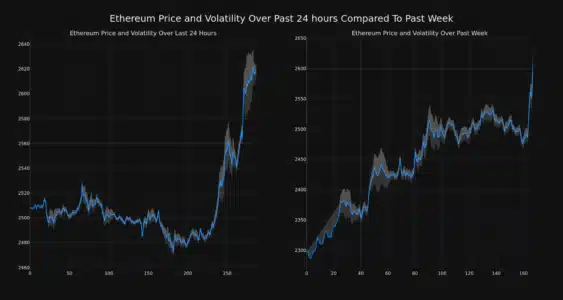
The gray bands in these charts are Bollinger Bands, a popular technical analysis tool used to gauge volatility. Here’s a quick breakdown of what Bollinger Bands indicate:
- Wider Bands = Higher Volatility: When the Bollinger Bands widen, or the gray area expands, it signifies increased price volatility. This means the price is experiencing more significant swings.
- Narrower Bands = Lower Volatility: Conversely, narrower bands suggest lower volatility, indicating more stable price movement.
Analyzing these bands helps traders and investors understand the risk and potential price ranges associated with Ethereum at different timeframes.
Trading Volume and Circulating Supply: Key Indicators
Price movement isn’t the only metric to consider. Trading volume and circulating supply provide further insights into the health and momentum of Ethereum’s market.
Interestingly, Ethereum’s trading volume has surged by 32.0% over the past week. This significant increase in trading activity often accompanies price rises, suggesting stronger market participation and interest. Furthermore, this volume increase is moving in tandem with a slight increase in the circulating supply of ETH, which has grown by 0.13%.
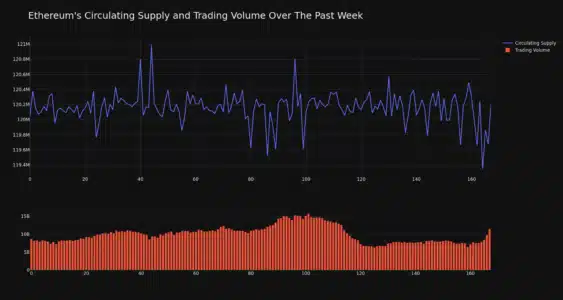
Currently, the circulating supply of Ethereum stands at 120.17 million ETH. A rise in circulating supply, coupled with increased trading volume, can be interpreted in various ways depending on the context of the market and broader economic factors.
Ethereum’s Market Position: Holding Strong at #2
Ethereum’s strong price performance and market activity are reflected in its market capitalization ranking. According to the latest data, Ethereum (ETH) holds the #2 position in market cap ranking, with a staggering $314.52 billion market capitalization. This solidifies Ethereum’s position as a leading cryptocurrency and a cornerstone of the decentralized finance (DeFi) and Web3 ecosystems.
In Conclusion: Is Ethereum’s Bull Run Just Beginning?
Ethereum’s recent price surge, coupled with increased trading volume and positive weekly gains, paints an encouraging picture for investors and enthusiasts. While the cryptocurrency market remains inherently volatile, these indicators suggest a strengthening bullish momentum for ETH. As always, it’s crucial to conduct thorough research and consider your own risk tolerance before making any investment decisions in the crypto space.
Disclaimer: The information provided is not trading nor financial advice. Bitcoinworld.co.in holds no liability for any trading or investments made based on the information provided on this page. We strongly recommend independent research and/or consultation with a qualified professional before making any trading or investment decisions.
#Binance #WRITE2EARN
Disclaimer: The information provided is not trading advice, Bitcoinworld.co.in holds no liability for any investments made based on the information provided on this page. We strongly recommend independent research and/or consultation with a qualified professional before making any investment decisions.