
Immutable (IMX) is making waves in the crypto market! If you’re keeping an eye on the charts, you’ve likely noticed IMX’s recent upward momentum. In the last 24 hours alone, the Immutable price has jumped by a solid 5.65%, currently sitting at $2.38. But what’s driving this surge, and is this just the beginning for IMX? Let’s dive into the latest price analysis and see what’s happening.
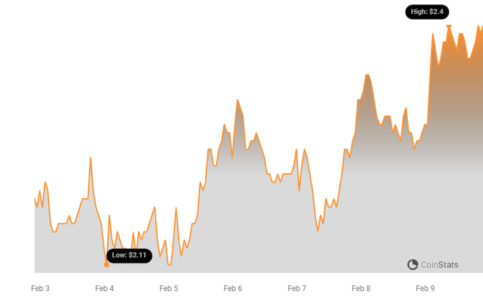
Looking at the bigger picture, IMX hasn’t just popped in the last day. Over the past week, it’s shown a consistent climb, increasing by over 8.0% from $2.21 to where it stands now. While this is exciting movement, it’s worth remembering that IMX has seen even higher peaks in the past. Its all-time high sits at $9.52. So, while we’re seeing positive momentum, there’s still a significant gap to close to reach those previous highs.
See Also: Price Analysis: Bittensor (TAO) Price Increased More Than 10% Within 24 Hours
Decoding the Price Swings: Daily vs. Weekly Volatility
To get a better grasp of IMX’s recent performance, let’s compare its price action over different timeframes. The charts below give us a visual breakdown of volatility over the last 24 hours versus the past week. This helps us understand if the recent price jump is a sudden spike or part of a more sustained trend.
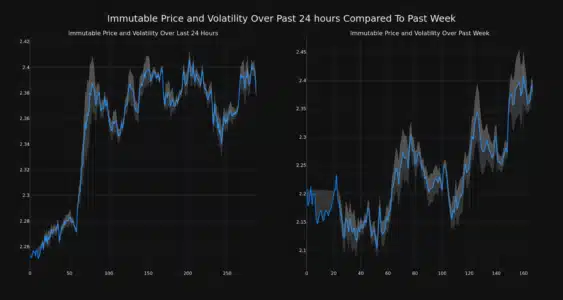
Notice those gray bands in the charts? Those are Bollinger Bands. Think of them as volatility meters. They widen when the price swings are big, indicating higher volatility, and narrow when the price is more stable. By looking at the width of these bands, we can quickly assess how much IMX’s price has been fluctuating recently, both daily and weekly.
Key Takeaway on Volatility:
- Wider Bollinger Bands = Higher Volatility: A larger gray area signals more significant price fluctuations.
- Narrower Bollinger Bands = Lower Volatility: A smaller gray area suggests more stable price movement.
Diving Deeper: Trading Volume and Circulating Supply – What’s the Story?
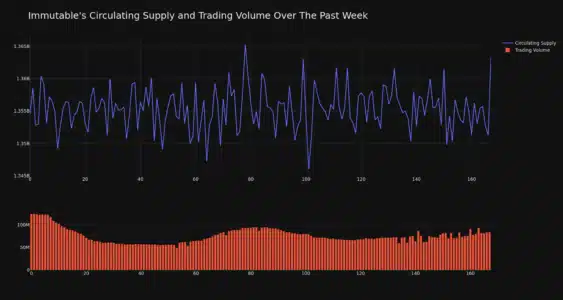
While the price is up, there’s an interesting counter-trend in trading volume. Over the past week, the trading volume for IMX has actually decreased by 32.0%. This might seem a bit unusual at first glance – price up, volume down? Typically, a price increase is supported by increased trading volume, suggesting stronger buying interest. However, in this case, the price rise is happening despite lower volume. Let’s contrast this with the circulating supply.
Interestingly, the circulating supply of IMX has increased by 0.65% over the same week. This means more IMX tokens are now available in the market. Let’s visualize this relationship:
What does this mean?
- Decreased Trading Volume (-32.0%): Could suggest less active trading in the short term, or potentially that the price increase is driven by fewer, but larger, transactions. It might also indicate less speculative interest at the current price level.
- Increased Circulating Supply (+0.65%): More tokens are available, which, under normal circumstances, could put downward pressure on price. However, in this case, the price is still increasing, suggesting strong underlying demand or other market factors at play.
Currently, the circulating supply of IMX is 1.36 billion tokens. This represents approximately 67.77% of its total maximum supply of 2.00 billion IMX. Understanding the tokenomics, including supply dynamics, is crucial for assessing the long-term potential of any cryptocurrency.
IMX Market Cap and Ranking: Where Does it Stand?
According to the latest data, Immutable (IMX) currently holds the #29 rank in market capitalization, with a market cap of $3.24 billion. This puts IMX firmly in the top tier of cryptocurrencies, showcasing its significant market presence and investor confidence. Market cap ranking is a useful indicator of a crypto’s overall size and relative importance within the broader crypto ecosystem.
In Conclusion: IMX – Momentum or Short-Term Fluctuation?
Immutable (IMX) is showing positive price movement, with a notable 5.65% increase in the last 24 hours and an 8% uptick over the week. While trading volume has decreased, the circulating supply has slightly increased, presenting a mixed picture. The market cap remains strong, placing IMX in the top 30 cryptocurrencies.
Is this a sustained upward trend? It’s too early to definitively say. Keep an eye on trading volume in the coming days to see if it picks up and supports further price appreciation. Also, monitoring broader market sentiment and developments within the Immutable X ecosystem, particularly in blockchain gaming and NFTs, will be crucial in understanding IMX’s future trajectory.
Disclaimer:
The information provided is not trading nor financial advice. Bitcoinworld.co.in holds no liability for any trading or investments made based on the information provided on this page. We strongly recommend independent research and/or consultation with a qualified professional before making any trading or investment decisions.
#Binance #WRITE2EARN
Disclaimer: The information provided is not trading advice, Bitcoinworld.co.in holds no liability for any investments made based on the information provided on this page. We strongly recommend independent research and/or consultation with a qualified professional before making any investment decisions.