Navigating the volatile world of cryptocurrency can feel like riding a rollercoaster. One moment you’re down, and the next, you’re soaring high. Injective (INJ), a prominent player in the decentralized finance (DeFi) space, is currently experiencing one of those upward swings. After a week of downward pressure, INJ is showing signs of recovery. Let’s dive into the latest price action and market dynamics surrounding Injective to understand what’s driving these movements and what it could mean for investors.
Injective (INJ) Bounces Back: A 24-Hour Price Surge
Over the last 24 hours, Injective (INJ) has demonstrated a notable positive shift, with its price climbing by 3.86%. This surge has pushed the price to $39.85, offering a welcome respite for INJ holders after a week of bearish trends.
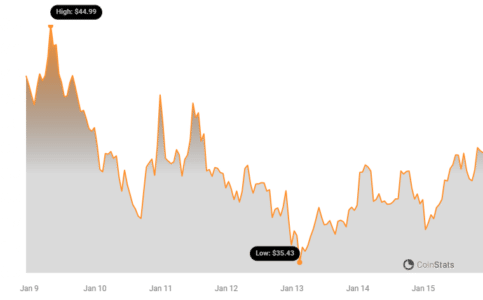
As you can see from the chart above, the recent 24-hour period paints a greener picture compared to the overall trend of the past week. But is this a temporary blip or the start of a sustained uptrend? Let’s delve deeper.
Weekly Retrospective: Contextualizing the Current Price Movement
While the 24-hour performance is encouraging, it’s crucial to view it within the context of the past week’s performance. In the last seven days, Injective (INJ) experienced a 6.0% price decrease, falling from $41.94 to its current level. This highlights the inherent volatility of the crypto market and the importance of considering longer timeframes for a comprehensive understanding.
Currently, INJ is trading below its all-time high of $45.01. Reaching and surpassing this peak remains a key target for bulls. Whether this recent positive momentum can propel INJ to new heights is a question on many investors’ minds.
Decoding Volatility: What Do Bollinger Bands Tell Us About INJ?
To better understand the risk and potential price swings associated with Injective, examining volatility is essential. Bollinger Bands are a popular technical analysis tool that helps visualize price volatility over a given period. The wider the bands, the higher the volatility, suggesting potentially larger price fluctuations.
Let’s take a look at the Bollinger Bands for INJ over the past 24 hours and the past week:
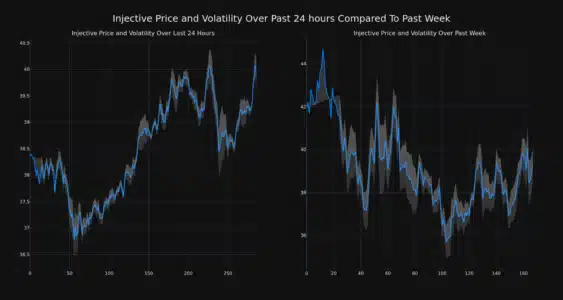
As depicted in the charts, the gray bands represent the Bollinger Bands. A wider band indicates higher volatility. By observing the width of these bands, we can gauge the degree of price fluctuation for both the daily and weekly timeframes. Are we seeing increased volatility recently? The charts provide a visual answer, allowing traders to assess potential risk levels.
See Also:
Trading Volume and Circulating Supply: Key Market Indicators
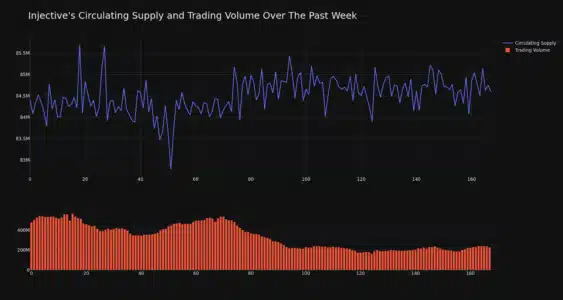
Beyond price and volatility, other crucial metrics provide insights into the health and momentum of a cryptocurrency. Trading volume and circulating supply are two such indicators.
Here’s how INJ fares in these aspects:
- Trading Volume: Interestingly, the trading volume for INJ has decreased significantly, tumbling by 53.0% over the past week. A decrease in trading volume can sometimes indicate waning interest or consolidation in the market. However, it can also precede significant price movements in either direction – a point to watch closely.
- Circulating Supply: On the other hand, the circulating supply of INJ has slightly increased by 0.22% over the past week. This increase brings the total circulating supply to 84.73 million INJ coins. Changes in circulating supply can impact the supply-demand dynamics of a cryptocurrency and potentially influence its price.
Market Cap and Ranking: Where Does INJ Stand?
Market capitalization provides a snapshot of a cryptocurrency’s overall value. Currently, Injective (INJ) holds a market cap of $3.38 billion, securing the #29 rank in the overall cryptocurrency market. This ranking reflects INJ’s significant position and investor interest within the broader crypto ecosystem.
Key Takeaways and Points to Consider
In summary, Injective (INJ) is currently exhibiting a mixed bag of signals:
- Positive 24-Hour Price Action: A welcome 3.86% price increase suggests short-term bullish momentum.
- Weekly Downtrend: However, this is set against a backdrop of a 6.0% weekly decline, indicating ongoing bearish pressure or correction.
- Decreased Trading Volume: A significant drop in trading volume raises questions about market conviction and could signal potential volatility ahead.
- Slightly Increased Circulating Supply: A minor increase in circulating supply has subtle implications for supply-demand dynamics.
- Solid Market Cap and Ranking: INJ remains a top-30 cryptocurrency by market cap, reflecting its established position in the market.
Looking Ahead: What’s Next for INJ?
The cryptocurrency market is notoriously unpredictable, and Injective (INJ) is no exception. While the recent 24-hour surge is encouraging, it’s crucial for investors to remain vigilant and conduct thorough research. Monitoring trading volume, broader market sentiment, and upcoming developments within the Injective ecosystem will be key to understanding future price movements.
Will INJ break through its all-time high soon? Will the reduced trading volume lead to increased volatility? These are questions that only time and market action will answer. Stay tuned for further updates and analysis as the Injective story unfolds.
Disclaimer: The information provided is not trading advice. Bitcoinworld.co.in holds no liability for any investments made based on the information provided on this page. We strongly recommend independent research and/or consultation with a qualified professional before making any investment decisions.
Disclaimer: The information provided is not trading advice, Bitcoinworld.co.in holds no liability for any investments made based on the information provided on this page. We strongly recommend independent research and/or consultation with a qualified professional before making any investment decisions.