
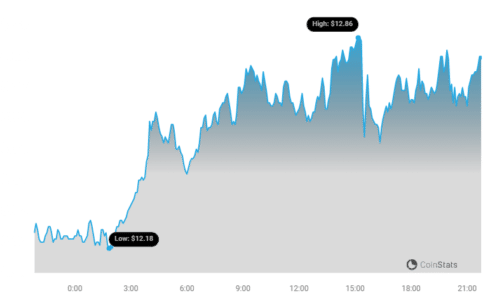
The cryptocurrency market never sleeps, and Internet Computer (ICP) is making headlines with a notable surge in its price. In the last 24 hours, ICP has experienced a robust 3.81% increase, pushing its price to $12.72. This positive movement is catching the attention of investors and traders alike. Let’s dive deeper into what’s driving this price action and what it means for the future of ICP.
ICP’s Weekly Performance: A Steady Climb
Looking beyond the daily fluctuations, ICP’s performance over the past week has been consistently positive. We’ve seen an uptick of over 2.0%, with the price moving from $12.42 to its current level. This gradual climb indicates a sustained interest and potentially growing confidence in Internet Computer. But is this just a short-term rally or the beginning of a more significant trend?
To understand the current price better, it’s crucial to remember ICP’s journey. While currently trading around $12, it’s worth noting that Internet Computer (ICP) once reached an all-time high of $700.65. This peak, achieved earlier in its lifecycle, sets a high benchmark and provides context for its current valuation. The question on everyone’s mind is, can ICP revisit those heights?
See Also: Price Analysis: Injective (INJ) Price Increased More Than 6% Within 24 Hours
Decoding ICP’s Volatility and Price Movement
Volatility is the heartbeat of the crypto market, and understanding it is key to making informed decisions. The chart below gives us a visual representation of Internet Computer’s price movement and volatility, comparing the last 24 hours (left) to the past week (right).
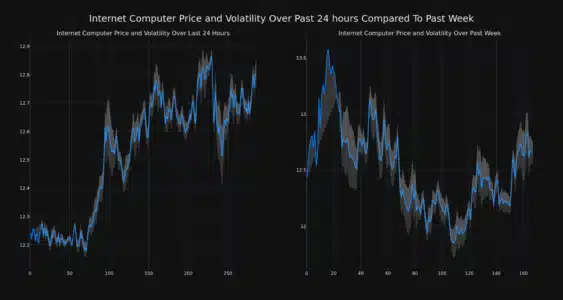
The gray bands you see are Bollinger Bands, a popular tool used to measure market volatility. Think of them as dynamic ranges that adapt to price fluctuations.
What do Bollinger Bands tell us?
- Wider Bands = Higher Volatility: When the bands widen, it indicates increased price fluctuations and uncertainty in the market.
- Narrower Bands = Lower Volatility: Conversely, narrower bands suggest price stability and lower volatility.
By observing the Bollinger Bands on the charts, we can gauge the level of risk and potential price swings associated with ICP in both the short term (24 hours) and the medium term (past week).
Trading Volume vs. Circulating Supply: A Diverging Trend
Now, let’s talk about trading volume and circulating supply – two crucial indicators that can offer insights into the health and momentum of a cryptocurrency.
Interestingly, while ICP’s price has been increasing, the trading volume has actually fallen by 46.0% over the past week. This might seem counterintuitive at first glance. Typically, a price increase is accompanied by a rise in trading volume, as more buyers and sellers participate in the market. However, in ICP’s case, the reduced trading volume could suggest a few possibilities:
- Hodling Behavior: Investors might be holding onto their ICP, anticipating further price appreciation, leading to less trading activity.
- Limited Sellers: A decrease in selling pressure could also result in lower trading volume while still allowing the price to rise if there’s consistent buying interest.
On the other hand, the circulating supply of ICP has slightly increased by 0.03% over the past week. While seemingly small, any increase in circulating supply can, in theory, exert downward pressure on price, assuming demand remains constant. In ICP’s case, the price increase despite a supply increase and volume decrease suggests underlying positive sentiment or buying pressure is strong enough to overcome these factors.
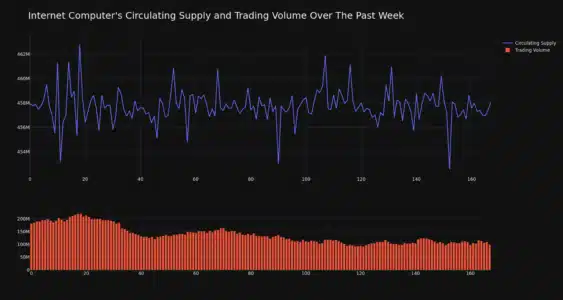
This slight increase brings the total circulating supply to 457.82 million ICP.
ICP’s Market Cap and Ranking: A Significant Player
Market capitalization is a key metric for evaluating the size and dominance of a cryptocurrency. Currently, Internet Computer holds the #18 rank in the cryptocurrency market cap rankings, with a market cap of $5.87 billion. This firmly places ICP among the top cryptocurrencies, indicating significant investor interest and capital invested in the project.
Key Takeaways and Considerations
Let’s summarize the key points from our ICP price analysis:
- Price Surge: ICP has seen a 3.81% price increase in the last 24 hours and a 2.0% increase over the past week, currently trading at $12.72.
- Volatility: Bollinger Bands indicate the level of price fluctuation, which can be observed in the provided charts.
- Trading Volume Decline: Trading volume has decreased by 46% in the past week, potentially suggesting hodling behavior or reduced selling pressure.
- Circulating Supply Increase: A slight 0.03% increase in circulating supply, now at 457.82 million ICP.
- Strong Market Cap: ICP holds a #18 market cap ranking at $5.87 billion, highlighting its significant market presence.
What does this mean for investors?
The recent price surge and positive weekly performance could signal renewed interest in Internet Computer. However, the declining trading volume warrants caution. It’s essential to conduct thorough research and consider your own risk tolerance before making any investment decisions. Keep an eye on market trends, ICP’s development updates, and broader crypto market sentiment to better understand the potential trajectory of ICP.
Disclaimer: The information provided is not trading nor financial advice. Bitcoinworld.co.in holds no liability for any trading or investments made based on the information provided on this page. We strongly recommend independent research and/or consultation with a qualified professional before making any trading or investment decisions.
#Binance #WRITE2EARN
Disclaimer: The information provided is not trading advice, Bitcoinworld.co.in holds no liability for any investments made based on the information provided on this page. We strongly recommend independent research and/or consultation with a qualified professional before making any investment decisions.