
Navigating the volatile world of cryptocurrency can feel like riding a rollercoaster. Just when you think you’ve got a handle on things, the market shifts. Today, we’re diving deep into the recent price action of Kaspa (KAS), a cryptocurrency that’s been making waves. Is the current dip a cause for concern, or just a momentary blip on its upward trajectory? Let’s break down the latest data and see what’s happening with Kaspa.
Kaspa (KAS) Price Overview: A Snapshot
As of the latest data, the price of Kaspa (KAS) is hovering around $0.11. Over the last 24 hours, we’ve observed a decrease of 3.53%. This short-term pullback might raise eyebrows, but it’s crucial to look at the bigger picture.
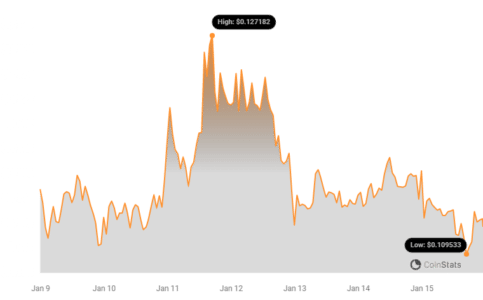
Looking at the past week, the story is slightly different. Kaspa has actually experienced an uptrend of 1.0%, starting from $0.11 and reaching its current level. This suggests that while there’s been a recent dip, the overall weekly performance is still positive. It’s typical in the crypto market to see daily fluctuations, and understanding these movements within a broader timeframe is key to informed decision-making.
See Also: Price Analysis: Celestia (TIA) Rose More Than 3% In 24 Hours
Volatility Check: Is Kaspa’s Price Action Bumpy?
Volatility is part and parcel of the cryptocurrency market. Understanding how volatile an asset is can help you gauge the risk and potential reward. Let’s examine Kaspa’s volatility over different periods.
The chart below gives us a visual representation of Kaspa’s price movement and volatility. On the left, we see the 24-hour view, and on the right, the weekly perspective.
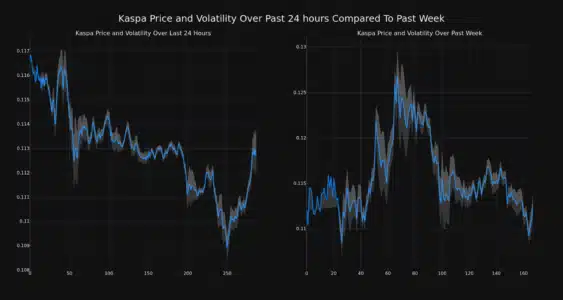
Those gray bands you see are called Bollinger Bands. They are a handy tool to measure volatility. Think of them as dynamic ranges that adapt to price fluctuations. When the bands are wider, it indicates higher volatility, meaning the price is swinging more dramatically. Conversely, narrower bands suggest lower volatility and more stable price movement.
Looking at the charts, we can visually assess the volatility in both the daily and weekly timeframes. Analyzing these bands helps traders and investors understand the potential risk and price fluctuation range of Kaspa.
Trading Volume and Circulating Supply: What Do They Tell Us?
Beyond price and volatility, other metrics offer valuable insights into the health and dynamics of a cryptocurrency. Let’s look at trading volume and circulating supply for Kaspa.
Interestingly, the trading volume for KAS has decreased by a significant 46.0% over the past week. A decrease in trading volume can sometimes indicate reduced interest or activity in the market for that particular coin. It’s a factor to keep an eye on, as sustained low volume could precede further price movements – either up or down, depending on other market forces.
On the other hand, the circulating supply of Kaspa has increased by 1.35% in the last week, now standing at over 22.32 billion coins. This increase in circulating supply is part of Kaspa’s tokenomics and emission schedule. It’s important to note that a growing circulating supply can sometimes exert downward pressure on price if demand doesn’t keep pace.
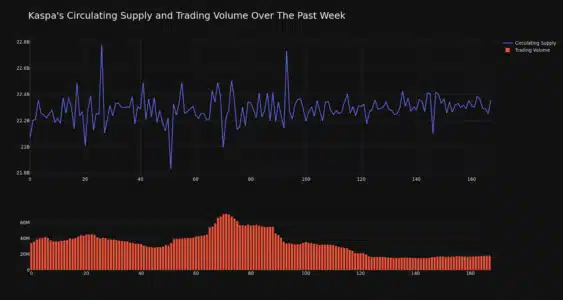
Currently, the circulating supply represents an estimated 77.77% of Kaspa’s maximum supply of 28.70 billion coins. This means that a significant portion of the total Kaspa supply is already in circulation, with the remaining to be gradually released over time.
Market Cap and Ranking: Where Does Kaspa Stand?
Market capitalization, or market cap, is a crucial metric for evaluating the size and dominance of a cryptocurrency. It’s calculated by multiplying the circulating supply by the current price. Kaspa currently holds the #40 rank in market capitalization, with a market cap of $2.52 billion. This ranking places Kaspa among the top cryptocurrencies in the market, indicating substantial investor interest and market value.
A high market cap generally suggests a more established and potentially less volatile cryptocurrency compared to lower-cap coins. However, it’s essential to remember that market cap is just one factor to consider when assessing a cryptocurrency’s potential.
Key Takeaways and Actionable Insights
Let’s summarize the key points from our Kaspa price analysis:
- Short-term Dip, Weekly Uptrend: Kaspa’s price has decreased by 3.53% in the last 24 hours, but it’s still up 1.0% over the past week. This suggests a short-term correction within a broader positive trend.
- Volatility Present: Bollinger Bands indicate price volatility in both daily and weekly timeframes, typical for cryptocurrencies. Traders should be aware of these fluctuations.
- Decreased Trading Volume: A 46.0% decrease in trading volume over the week could signal reduced market activity and warrants monitoring for potential future price movements.
- Increased Circulating Supply: The circulating supply has increased, which is in line with Kaspa’s tokenomics but could exert some downward pressure if demand doesn’t keep pace.
- Solid Market Cap and Ranking: Kaspa’s #40 market cap ranking and $2.52 billion market cap demonstrate its significant presence in the crypto market.
Actionable Insights:
- For Traders: Be mindful of the volatility and recent price dip. Utilize tools like Bollinger Bands to understand potential price ranges. Monitor trading volume for signals of market momentum shifts.
- For Investors: Consider the long-term uptrend despite short-term fluctuations. The increasing circulating supply and market cap ranking provide a broader context for Kaspa’s development. Further research into Kaspa’s technology and adoption is recommended.
Conclusion: Kaspa’s Path Forward
Kaspa’s recent price action presents a mixed picture. The short-term dip is counterbalanced by a positive weekly trend, highlighting the inherent volatility of the crypto market. While the decrease in trading volume is something to watch, Kaspa’s solid market cap ranking and ongoing development within its ecosystem suggest continued relevance in the cryptocurrency space.
As with any cryptocurrency investment, thorough research and understanding your risk tolerance are paramount. Keep an eye on Kaspa’s price movements, technological advancements, and broader market trends to make informed decisions. The crypto journey is rarely a straight line upwards, and understanding these fluctuations is key to navigating the exciting world of digital assets.
Disclaimer: The information provided is not trading advice. Bitcoinworld.co.in holds no liability for any investments made based on the information provided on this page. We strongly recommend independent research and/or consultation with a qualified professional before making any investment decisions.
Disclaimer: The information provided is not trading advice, Bitcoinworld.co.in holds no liability for any investments made based on the information provided on this page. We strongly recommend independent research and/or consultation with a qualified professional before making any investment decisions.