Hey crypto enthusiasts! Buckle up, because Litecoin (LTC) is making waves! If you’ve been keeping an eye on the market, you’ve probably noticed a significant jump in LTC’s value. Let’s dive straight into the exciting details of Litecoin’s recent price surge and understand what’s fueling this upward momentum.
Litecoin’s Impressive 24-Hour Price Rally
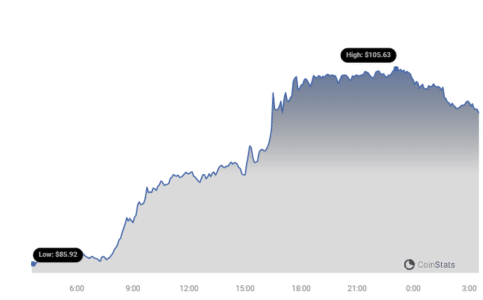
In the past 24 hours, Litecoin’s price has experienced a remarkable 18.15% increase! This surge has pushed the price to $104.39, according to recent data. This is a significant move, grabbing the attention of traders and investors alike. Take a look at the price chart below to visualize this impressive climb:
But it’s not just a 24-hour story. Let’s zoom out and see the bigger picture.
Weekly Performance: Sustained Upward Trend
Over the past week, Litecoin has demonstrated consistent growth, showing an uptick of over 18.0%. The price has climbed from $89.13 to its current level, indicating a strong and sustained bullish trend. This consistent positive movement suggests more than just a fleeting pump.
See Also: Price Analysis: Bitcoin Cash (BCH) Price Increased More Than 4% Within 24 Hours
While this recent surge is exciting, it’s always good to remember where Litecoin stands in its historical journey. Currently, the coin is still trading below its all-time high of $410.26. This gives us perspective on the potential growth still ahead and the journey LTC has already undertaken.
Decoding Litecoin’s Price and Volatility
To better understand the dynamics of this price movement, let’s look at the volatility. The charts below compare Litecoin’s price movement and volatility over the last 24 hours versus the past week. This helps us see how the recent surge fits into the broader price action.
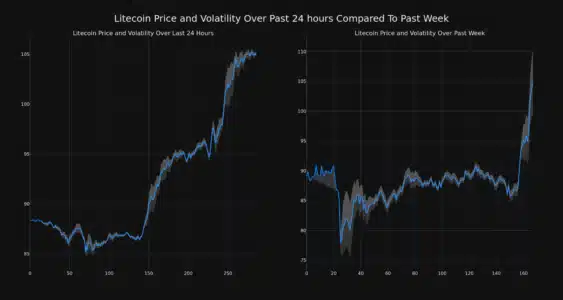
Notice the gray bands in the charts? These are Bollinger Bands, a handy tool for measuring volatility. They essentially show the range within which Litecoin’s price typically fluctuates.
Key points about Bollinger Bands:
- Wider Bands = Higher Volatility: When the gray bands widen, it indicates increased price swings and uncertainty in the market.
- Narrower Bands = Lower Volatility: Conversely, narrower bands suggest a period of relative price stability.
By observing the Bollinger Bands, we can get a visual sense of how volatile Litecoin’s price has been recently, both in the short term (24 hours) and over the week.
Trading Volume and Circulating Supply: Key Market Indicators
Beyond price and volatility, let’s consider other important market metrics:
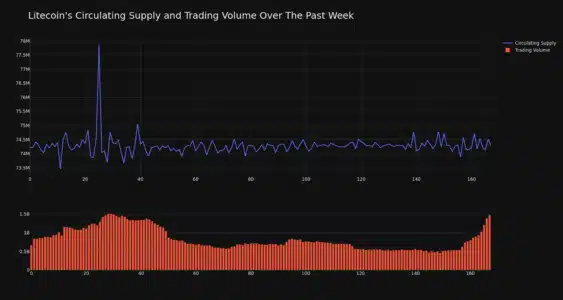
- Trading Volume Surge: A significant 121.0% increase in trading volume over the past week signals heightened interest and activity around Litecoin. This often accompanies price surges, as more traders buy and sell the asset.
- Circulating Supply: The circulating supply of LTC has seen a slight increase of 0.06%, reaching over 74.30 million coins.
- Supply Dynamics: This circulating supply represents approximately 88.45% of Litecoin’s max supply of 84.00 million coins. Understanding the supply dynamics is crucial for long-term price predictions.
Here’s a chart illustrating the circulating supply and trading volume trends:
Litecoin’s Market Standing
Currently, Litecoin holds the #21 rank in market capitalization, with a market cap of $7.80 billion. This ranking reflects Litecoin’s significant position within the broader cryptocurrency market and its established presence as a leading altcoin.
Disclaimer: The information provided is not trading advice. Bitcoinworld.co.in holds no liability for any investments made based on the information provided on this page. We strongly recommend independent research and/or consultation with a qualified professional before making any investment decisions.
#Binance #WRITE2EARN
Disclaimer: The information provided is not trading advice, Bitcoinworld.co.in holds no liability for any investments made based on the information provided on this page. We strongly recommend independent research and/or consultation with a qualified professional before making any investment decisions.