
Navigating the volatile world of cryptocurrency can feel like riding a rollercoaster. Recently, Stacks (STX), a token known for bringing smart contracts and decentralized applications (dApps) to Bitcoin, has experienced a notable price dip. Are you wondering what’s behind this downward trend and what it means for the future of STX? Let’s dive into a detailed price analysis to understand the recent movements of Stacks and explore the factors at play.
Stacks (STX) Price Decline: A Closer Look
Over the past 24 hours, the price of Stacks (STX) has decreased by 4.01%, settling at approximately $1.6. This isn’t an isolated daily fluctuation; it’s part of a larger downward trend observed over the last week. Looking back seven days, STX has seen a significant 18.0% drop, falling from $1.96 to its current price point. This consistent decline warrants a closer examination to understand the underlying market dynamics.
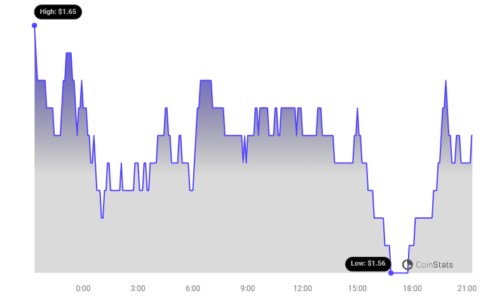
The chart above visually represents this price movement, providing a clear picture of the recent downtrend. But price alone doesn’t tell the whole story. To get a more comprehensive understanding, we need to consider other key indicators like volatility, trading volume, and circulating supply.
Volatility Check: Are Things Getting Shaky for STX?
Volatility is a crucial metric in crypto markets, indicating how much and how quickly the price of an asset fluctuates. High volatility can mean higher risk but also potential for higher rewards. To assess the volatility of Stacks, let’s analyze the Bollinger Bands, a tool used to measure price fluctuations over time.
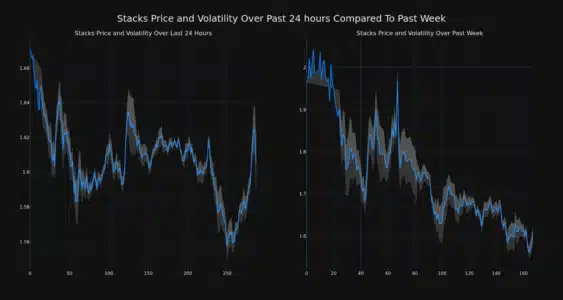
The charts above compare Stacks’ price movement and volatility over the past 24 hours (left) and the past week (right). The gray bands you see are Bollinger Bands.
- Bollinger Bands Explained: These bands widen when volatility increases and narrow when volatility decreases. The wider the bands, the more significant the price swings are, indicating higher market uncertainty.
- Interpreting the Charts: By observing the width of the gray bands in the charts, we can gauge the volatility of STX in both the short-term (daily) and medium-term (weekly). Wider bands suggest greater price fluctuations during those periods.
See Also: Price Analysis: Kaspa (KAS) Down More Than 3% Within 24 Hours
Trading Volume and Circulating Supply: What Do They Tell Us?
Beyond price and volatility, trading volume and circulating supply are vital indicators to consider when analyzing a cryptocurrency’s performance.
- Trading Volume: This represents the total amount of STX coins traded within a specific period. A significant drop in trading volume, as observed with Stacks, can indicate decreased investor interest or liquidity.
- Circulating Supply: This is the number of STX coins currently in circulation and available to the public. An increase in circulating supply can sometimes exert downward pressure on price if demand doesn’t keep pace.
In the case of Stacks, the trading volume has dramatically tumbled by 90.0% over the past week. Simultaneously, the circulating supply of STX has increased by 1.07%. Let’s visualize this data:
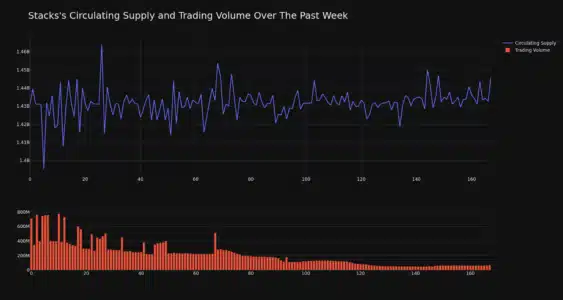
This increase in circulating supply brings the total to 1.44 billion STX coins. This figure represents a substantial portion of the total max supply, estimated to be 1.82 billion STX, specifically around 78.94%.
Market Cap and Ranking: Where Does STX Stand Now?
Market capitalization, or market cap, is calculated by multiplying the circulating supply of a cryptocurrency by its current price. It’s a key metric to understand the relative size and dominance of a crypto asset. According to our data, Stacks currently holds the #42 rank in market capitalization, with a market cap of $2.30 billion.
While a ranking of #42 is still within the top tier of cryptocurrencies, the recent price decline and reduced trading volume might suggest a shift in market sentiment or broader market corrections affecting STX.
Key Takeaways and Considerations
- Price Decline: STX has experienced a significant price decrease over the past week, continuing into the last 24 hours.
- Increased Volatility: Bollinger Bands suggest ongoing volatility in STX’s price movements.
- Decreased Trading Volume: A sharp 90% drop in trading volume indicates reduced market activity and potentially lower liquidity.
- Increased Circulating Supply: A slight increase in circulating supply might be contributing to downward price pressure.
- Market Cap Rank: Despite the recent dip, STX remains a top 50 cryptocurrency by market capitalization.
What Could Be Next for Stacks?
Predicting future price movements in the crypto market is inherently challenging. However, understanding the current trends and market indicators provides valuable context. The recent price decline in Stacks could be attributed to various factors, including:
- Broader Market Correction: The entire cryptocurrency market can be influenced by macroeconomic factors, Bitcoin’s price movements, and overall investor sentiment. A general market downturn could be impacting STX.
- Profit-Taking: After periods of growth, some investors may choose to take profits, leading to sell-offs and price corrections.
- Specific News or Developments: Keep an eye out for any specific news or developments related to the Stacks ecosystem, Bitcoin, or regulatory changes that could be influencing investor sentiment.
Is this a buying opportunity? Or a sign of further decline? That’s a question every investor must consider based on their own research and risk tolerance. Analyzing on-chain metrics, monitoring community sentiment, and staying updated on project developments are crucial steps for informed decision-making.
Disclaimer: The information provided is not trading advice. Bitcoinworld.co.in holds no liability for any investments made based on the information provided on this page. We strongly recommend independent research and/or consultation with a qualified professional before making any investment decisions.
In Conclusion: Staying Informed in the Crypto Space
The recent price movement of Stacks (STX) highlights the dynamic and often unpredictable nature of the cryptocurrency market. By analyzing price trends, volatility, trading volume, and circulating supply, we gain a clearer picture of the current market situation. Staying informed, conducting thorough research, and understanding your own investment risk profile are essential for navigating the exciting yet complex world of crypto investments. Keep tracking STX and the broader market to make well-informed decisions in your crypto journey!
Disclaimer: The information provided is not trading advice, Bitcoinworld.co.in holds no liability for any investments made based on the information provided on this page. We strongly recommend independent research and/or consultation with a qualified professional before making any investment decisions.