Cryptocurrency markets are known for their rollercoaster rides, and Stacks (STX) is no exception. If you’re keeping an eye on STX, you’ve probably noticed some interesting price action lately. Over the past day, Stacks has shown a positive surge, climbing by 3.81% to reach $1.52. But is this upward movement a flash in the pan, or could it signal a more sustained bullish trend for Stacks? Let’s dive into the details and analyze what’s driving STX’s price and what it could mean for investors.

Stacks (STX) Price: A 24-Hour Snapshot of Gains
In the last 24 hours, Stacks has demonstrated a notable price increase. This positive shift is a welcome change for STX holders, especially considering the slightly negative performance observed over the past week. While the daily gain is encouraging, it’s crucial to look at the bigger picture. Let’s break down the recent price movements:
- Current Price: $1.52
- 24-Hour Change: +3.81%
- Past Week Performance: -2.0% (decline from $1.55)
- All-Time High: $3.39
As you can see, despite the recent daily rise, STX is still below its price point from a week ago and significantly lower than its all-time high. This highlights the volatile nature of cryptocurrency markets and the importance of analyzing trends over different timeframes.
See Also:
Decoding STX Volatility: What Do the Charts Tell Us?
To understand the dynamics of STX’s price movement, examining volatility is key. Volatility essentially measures how much the price of an asset fluctuates over time. Higher volatility means more significant price swings, which can present both opportunities and risks for traders. Let’s look at the provided charts to understand STX’s volatility better.
Stacks Price and Volatility ChartThe charts above utilize Bollinger Bands (the gray bands) to visualize volatility. Bollinger Bands are a popular technical analysis tool that helps to gauge the range within which a price typically trades. Here’s a simplified explanation:
- Wider Bands = Higher Volatility: When the Bollinger Bands widen, it indicates that the price is experiencing larger fluctuations, meaning higher volatility. Conversely, narrower bands suggest lower volatility and more stable price movement.
- Daily vs. Weekly Volatility: The charts compare STX’s volatility over 24 hours (left) versus the past week (right). By comparing the width of the gray bands, you can visually assess whether volatility has been higher on a daily or weekly basis.
Analyzing these charts can help traders and investors understand the risk level associated with STX at different timeframes. Periods of high volatility might be attractive to day traders looking for quick profits, but they also carry greater risk. Lower volatility periods might be preferred by investors seeking more stable, longer-term positions.
Trading Volume and Circulating Supply: Unpacking the Numbers
Beyond price and volatility, trading volume and circulating supply are crucial metrics to consider when analyzing a cryptocurrency like Stacks. Let’s break down what the data reveals:
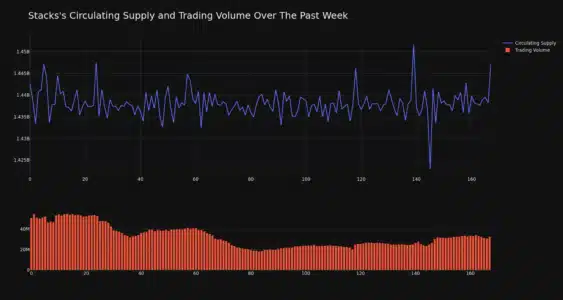
- Trading Volume Decline: Over the past week, STX’s trading volume has decreased by 36.0%. A decrease in trading volume can sometimes indicate waning interest or reduced market activity for the coin. It’s worth monitoring whether this trend continues or if volume picks up again.
- Circulating Supply Increase: Interestingly, while trading volume decreased, the circulating supply of STX has increased by 0.31% over the same week. Circulating supply refers to the number of coins that are currently available to be traded in the market.
The increase in circulating supply, bringing it to 1.44 billion STX, means there are more coins available in the market. This represents approximately 79.11% of the total max supply of 1.82 billion STX. Changes in circulating supply can sometimes influence price, although the relationship is complex and depends on various market factors.
STX Market Cap and Ranking: Where Does Stacks Stand?
Market capitalization, or market cap, is a crucial metric that reflects the total value of a cryptocurrency. It’s calculated by multiplying the current price of a coin by its circulating supply. Currently, Stacks holds a market cap of $2.18 billion, placing it at rank #43 in the overall cryptocurrency market rankings.
A higher market cap generally indicates a larger, more established cryptocurrency. While market cap ranking isn’t the only factor to consider, it provides a useful benchmark for comparing the size and relative popularity of different cryptocurrencies.
Key Takeaways and What to Watch For
In summary, Stacks (STX) has shown a positive price movement in the last 24 hours, offering a potential glimmer of hope after a slightly negative week. However, it’s essential to remember that the cryptocurrency market is dynamic and influenced by numerous factors. Here are some key points to keep in mind:
- Short-Term vs. Long-Term Trends: The 24-hour price rise is encouraging, but it’s crucial to observe if this momentum can be sustained and translate into a longer-term bullish trend.
- Volatility Monitoring: Keep an eye on STX’s volatility. Increased volatility can lead to both potential gains and losses. Use tools like Bollinger Bands to understand the current volatility levels.
- Trading Volume and Supply Dynamics: Monitor trading volume for signs of renewed market interest. Also, be aware of changes in circulating supply as they can potentially impact price.
- Broader Market Sentiment: Cryptocurrency prices are often influenced by the overall market sentiment, particularly Bitcoin’s performance. Keep an eye on broader market trends to understand potential external factors affecting STX.
Disclaimer: The information provided is not trading nor financial advice. Bitcoinworld.co.in holds no liability for any trading or investments made based on the information provided on this page. We strongly recommend independent research and/or consultation with a qualified professional before making any trading or investment decisions.
#Binance #WRITE2EARN
Disclaimer: The information provided is not trading advice, Bitcoinworld.co.in holds no liability for any investments made based on the information provided on this page. We strongly recommend independent research and/or consultation with a qualified professional before making any investment decisions.