
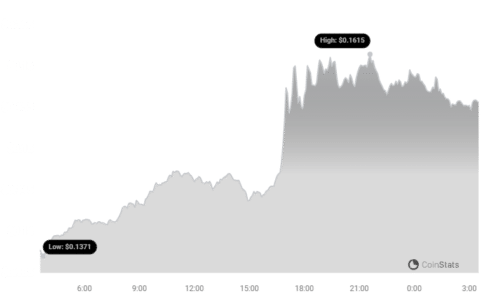
Cryptocurrency markets are known for their rapid fluctuations, and Stellar (XLM) has recently caught the eye of investors. Over the last 24 hours, XLM has experienced a significant surge, jumping by a notable 12.19% to reach $0.16. Is this just a fleeting pump, or is there more to this upward trend? Let’s dive into a detailed price analysis to understand what’s fueling Stellar’s recent bullish momentum.
What’s Driving Stellar’s Price Rally?
The recent price action isn’t isolated to just the last day. Zooming out slightly, we see that Stellar has been on a positive trajectory for the past week. The data reveals an 8.0% gain over the last seven days, climbing from $0.15 to its current price point. This consistent upward movement suggests more than just intraday trading at play.
While pinpointing the exact cause of any crypto price movement is challenging, several factors could be contributing to Stellar’s positive performance:
- Broader Market Sentiment: The overall cryptocurrency market often moves in tandem. If Bitcoin and Ethereum are experiencing gains, it can create a ripple effect, lifting other altcoins like XLM.
- Project Developments: Any positive news or developments within the Stellar ecosystem, such as partnerships, technological upgrades, or increased adoption, can boost investor confidence and drive demand.
- Increased Trading Volume: As we’ll see shortly, trading volume for XLM has significantly increased, indicating heightened interest and activity around the coin.
- Technical Analysis Factors: Traders often use technical analysis – chart patterns, indicators, etc. – to make decisions. Positive technical signals could be attracting buyers to XLM.
See Also: Price Analysis: Toncoin (TON) Price Increased More Than 15% Within 24 Hours
It’s worth noting that despite this recent positive momentum, Stellar is still trading below its all-time high of $0.88. This leaves considerable room for potential growth if the bullish trend continues.
XLM Price Volatility: A Closer Look
To better understand the dynamics of Stellar’s price movement, let’s examine volatility. Volatility measures how much the price of an asset fluctuates over time. High volatility means prices can swing dramatically, while low volatility suggests more stable price action.
The chart below utilizes Bollinger Bands to visualize Stellar’s price volatility over both the past 24 hours and the last week. Bollinger Bands are a handy tool in technical analysis, providing a visual representation of price volatility. The gray bands widen when volatility increases and narrow when it decreases.
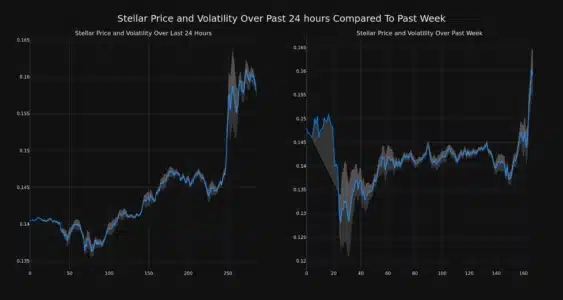
Analyzing the chart, we can observe the volatility in XLM’s price over different timeframes. Wider bands indicate periods of higher price fluctuation, which can be important for traders to consider when making decisions.
Trading Volume and Circulating Supply: Key Indicators
Beyond price and volatility, trading volume and circulating supply offer further insights into Stellar’s market dynamics.
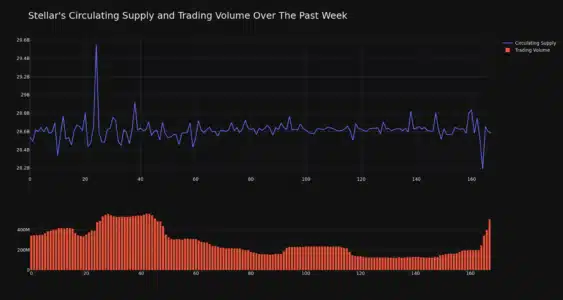
- Trading Volume Surge: Impressively, Stellar’s trading volume has jumped by 48.0% in the past week. A significant increase in trading volume often accompanies price movements, suggesting stronger conviction behind the trend. Higher volume can indicate greater liquidity and potentially more sustainable price changes.
- Circulating Supply Update: The circulating supply of XLM has slightly increased by 0.16% over the past week, now exceeding 28.63 billion coins. This represents approximately 57.27% of Stellar’s maximum supply of 50 billion XLM. Changes in circulating supply can sometimes influence price, although in this case, the change is relatively small.
XLM Market Cap and Ranking
Currently, Stellar (XLM) holds the #31 rank in market capitalization, with a market cap of $4.55 billion. Market capitalization, calculated by multiplying the circulating supply by the current price, provides a sense of a cryptocurrency’s overall size and dominance within the market. A higher market cap generally indicates a more established and potentially less volatile cryptocurrency compared to lower-cap altcoins.
Key Takeaways for XLM Investors
In summary, Stellar (XLM) has demonstrated strong positive price action recently, with a 12% surge in the last 24 hours and an 8% gain over the past week. This is supported by a significant increase in trading volume, suggesting growing market interest. While volatility remains a factor, understanding these dynamics can help investors better interpret market movements.
At a Glance: Stellar (XLM) Price Performance
| Metric | Value |
|---|---|
| 24-Hour Price Increase | 12.19% |
| Weekly Price Increase | 8.0% |
| Current Price | $0.16 |
| Market Cap Ranking | #31 |
| Trading Volume Increase (Past Week) | 48.0% |
Disclaimer: The information provided is not trading advice. Bitcoinworld.co.in holds no liability for any investments made based on the information provided on this page. We strongly recommend independent research and/or consultation with a qualified professional before making any investment decisions.
#Binance #WRITE2EARN
Disclaimer: The information provided is not trading advice, Bitcoinworld.co.in holds no liability for any investments made based on the information provided on this page. We strongly recommend independent research and/or consultation with a qualified professional before making any investment decisions.