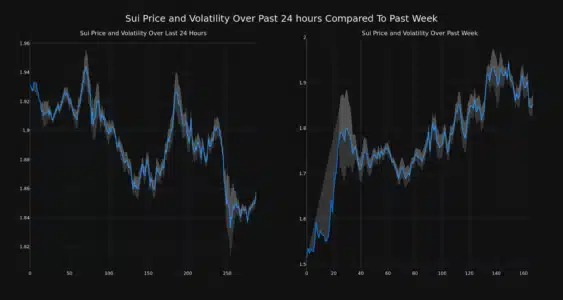
Cryptocurrency markets are known for their rollercoaster rides, and Sui (SUI) is no exception. After a remarkable 23% surge over the past week, SUI is currently experiencing a slight pullback. In the last 24 hours, the price of Sui (SUI) has decreased by 3.99%, settling at $1.85. Is this a cause for concern, or simply a normal market correction? Let’s dive into the details to understand what’s happening with SUI.
SUI Price Dip: A Minor Setback or a Trend Reversal?
While a 3.99% drop in a day might seem alarming at first glance, it’s crucial to consider the bigger picture. As the provided data highlights, this daily dip comes after a significant positive trend. Over the preceding week, SUI’s price impressively jumped by 23.0%, climbing from $1.51 to its current level. This context is vital – is today’s decrease merely a breather after a strong rally?

See Also: BONK Surged 13% Following Potential Partnership With Revolut On Learn & Earn Deal
Volatility Check: Is SUI Becoming More Unpredictable?
To better understand SUI’s price movements, examining volatility is key. Volatility essentially measures how much the price of an asset fluctuates over time. Higher volatility means more significant price swings, both upwards and downwards.
The chart below provides a visual comparison of SUI’s price movement and volatility over two different timeframes:
- Past 24 Hours (Left Chart): This shows the very recent price action and volatility.
- Past Week (Right Chart): This gives a broader perspective, illustrating the volatility over the week that included the 23% price increase.

Understanding Bollinger Bands: The gray bands in the charts are Bollinger Bands. These are a popular technical analysis tool used to measure volatility.
- Wider Bands = Higher Volatility: When the bands widen, or the gray area expands, it signifies increased volatility. This means the price is experiencing larger and more rapid fluctuations.
- Narrower Bands = Lower Volatility: Conversely, narrower bands indicate lower volatility and more stable price movement.
By observing the Bollinger Bands, traders and investors can get a sense of SUI’s price stability or potential for dramatic swings.
Trading Volume vs. Circulating Supply: What’s the Story?
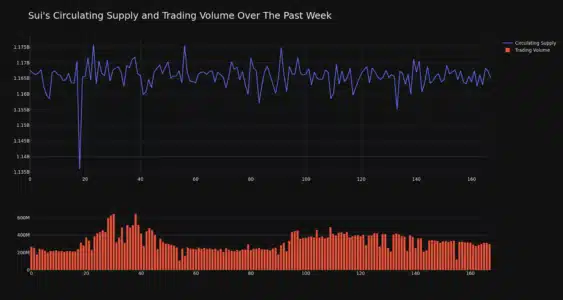
Analyzing trading volume and circulating supply can offer further insights into SUI’s market dynamics. Let’s break down what these metrics tell us:
- Trading Volume Surge: Interestingly, the trading volume for SUI has increased by 11.0% over the past week. A rise in trading volume often suggests increased interest and activity around the coin. This could be a sign of growing investor attention, even amidst the recent price dip.
- Circulating Supply Decrease: On the other hand, the circulating supply of SUI has slightly decreased by 0.22%. Circulating supply refers to the number of coins that are currently available for public trading. A decrease can sometimes be bullish, as it reduces the immediate sell pressure, assuming demand remains constant or increases.

Currently, the circulating supply of SUI stands at 1.17 billion coins. This represents approximately 11.66% of its total maximum supply of 10.00 billion. The relatively low percentage of circulating supply compared to the max supply is something to keep in mind for long-term holders, as future releases of coins could potentially impact price dynamics.
SUI Market Cap and Ranking: Where Does it Stand?
Market capitalization (market cap) is a crucial metric to assess the overall size and dominance of a cryptocurrency. It’s calculated by multiplying the circulating supply by the current price. According to the latest data, SUI’s current market cap is $2.16 billion, placing it at the #48 rank among all cryptocurrencies.
A market cap of over $2 billion indicates that SUI is a significant player in the crypto space, reflecting substantial investor interest and capital inflow.
Key Takeaways and Looking Ahead
In summary, while SUI has experienced a minor price correction in the last 24 hours, it’s essential to view this within the context of its strong weekly performance. Here are the key points to consider:
- Short-Term Dip, Long-Term Potential?: The current price decrease appears to be a short-term fluctuation after a significant pump. The underlying positive trend from the past week remains relevant.
- Increased Trading Volume: The 11% increase in trading volume suggests continued interest in SUI, which can be a positive sign.
- Volatility in Check: Monitoring volatility using tools like Bollinger Bands is crucial for understanding the risk associated with SUI trading.
- Market Cap Strength: SUI’s solid market cap ranking at #48 demonstrates its established position in the crypto market.
Is this a buying opportunity? As always, that depends on your individual investment strategy and risk tolerance. A price dip after a rally can sometimes present an opportunity for investors who believe in the long-term potential of the asset. However, thorough research and due diligence are paramount before making any investment decisions.
Disclaimer: The information provided is not trading nor financial advice. Bitcoinworld.co.in holds no liability for any trading or investments made based on the information provided on this page. We strongly recommend independent research and/or consultation with a qualified professional before making any trading or investment decisions.
#Binance #WRITE2EARN
Disclaimer: The information provided is not trading advice, Bitcoinworld.co.in holds no liability for any investments made based on the information provided on this page. We strongly recommend independent research and/or consultation with a qualified professional before making any investment decisions.


