Cardano (ADA), a prominent name in the crypto sphere, has been navigating the volatile currents of the market. If you’re tracking ADA, you’ve likely noticed some interesting price action recently. After a slight dip over the past week, is Cardano poised for a rebound? Let’s dive into the latest price movements and what they might signify for ADA holders and potential investors.
Cardano (ADA) Price: A 24-Hour Upswing Amidst Weekly Fluctuations
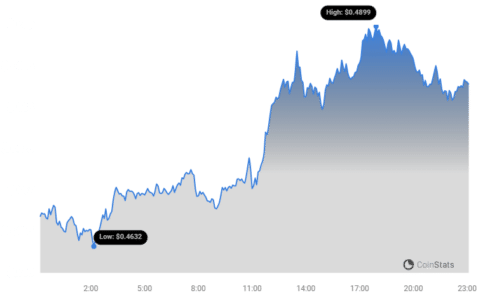
In the last 24 hours, Cardano’s price has perked up, registering a 4.12% increase. This positive shift brings the current price to $0.49 as of today. However, zooming out to the past week reveals a slightly different picture. Over the last seven days, ADA experienced a minor downtrend, with an overall 2.0% decrease from $0.49 to its current level. This mixed bag of short-term gain and slight weekly loss highlights the typical volatility we often see in the crypto market.

It’s worth remembering that Cardano once soared to an all-time high of $3.09. While the current price is a considerable distance from this peak, understanding these fluctuations is crucial for anyone involved in the ADA market.
Decoding Cardano’s Price Swings: Volatility Explained
To better understand these price movements, let’s look at volatility. Volatility essentially measures how much the price of an asset swings up and down over time. High volatility means prices can change dramatically and quickly, while low volatility suggests more stable price movement.
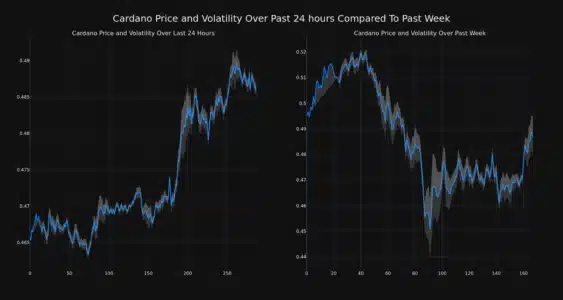
The chart below provides a visual representation of Cardano’s price volatility:

Notice the Bollinger Bands (the gray bands) in the chart. These bands are a popular tool for measuring volatility.
- Wider Bands = Higher Volatility: When the Bollinger Bands widen, it indicates increased price fluctuations and higher volatility. This means the price of ADA is experiencing larger swings.
- Narrower Bands = Lower Volatility: Conversely, narrower bands suggest lower volatility and more stable price action.
By observing the width of these bands for both the daily (left chart) and weekly (right chart) price movements, you can get a sense of the volatility environment surrounding Cardano. Currently, the charts suggest moderate volatility in ADA’s price.
Trading Volume and Circulating Supply: Key Market Indicators
Beyond price and volatility, two other crucial metrics to consider are trading volume and circulating supply. Let’s break down what these mean for Cardano:

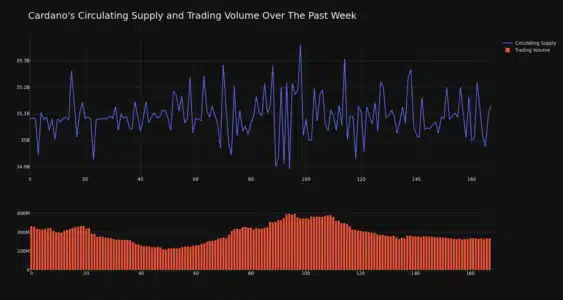
- Trading Volume: This represents the total amount of ADA coins that have been traded over a specific period. A decrease in trading volume, like the 28.0% tumble experienced by Cardano over the past week, can sometimes indicate waning interest or indecision in the market. Lower volume can also amplify price volatility, as fewer trades are needed to move the price significantly.
- Circulating Supply: This refers to the number of ADA coins currently in circulation and available to be traded. Cardano’s circulating supply has risen by 0.14% recently. An increase in circulating supply can, under certain circumstances, exert downward pressure on price if demand doesn’t keep pace. However, in Cardano’s case, the increase is quite marginal.
Currently, the circulating supply of ADA stands at 35.09 billion coins. This is a significant portion – approximately 77.98% – of Cardano’s maximum possible supply of 45.00 billion ADA.
Cardano’s Market Cap and Ranking: Where Does ADA Stand?
Market capitalization, or market cap, is a vital metric that reflects the total value of a cryptocurrency. It’s calculated by multiplying the current price of a coin by its circulating supply. Cardano currently holds a market cap of $17.06 billion.
According to our data, this market cap places ADA at the #9 rank among all cryptocurrencies. This ranking highlights Cardano’s position as a leading cryptocurrency with a substantial market presence.
In Conclusion: Navigating Cardano’s Price Landscape
Cardano’s recent price action presents a mixed picture. The 24-hour surge is a welcome sign for ADA enthusiasts, but the slight weekly dip reminds us of the inherent volatility in the crypto market. By understanding factors like volatility, trading volume, and circulating supply, investors can gain a more nuanced perspective on ADA’s price movements and potential future trajectory.
Keep an eye on these key indicators as you navigate the Cardano market. Will the recent 4% surge mark the beginning of a sustained upward trend, or is it a temporary blip in a broader period of consolidation? Only time will tell, but staying informed is your best tool in the dynamic world of cryptocurrency.
See Also: Price Analysis: The Price Of Wrapped Bitcoin (WBTC) Increased More Than 5% Within 24 Hours
Disclaimer: The information provided is not trading nor financial advice. Bitcoinworld.co.in holds no liability for any trading or investments made based on the information provided on this page. We strongly recommend independent research and/or consultation with a qualified professional before making any trading or investment decisions.
Disclaimer: The information provided is not trading advice, Bitcoinworld.co.in holds no liability for any investments made based on the information provided on this page. We strongly recommend independent research and/or consultation with a qualified professional before making any investment decisions.


