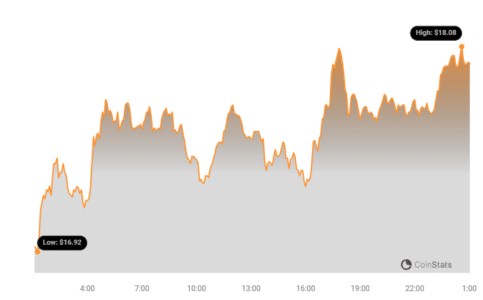
The cryptocurrency market is always buzzing with activity, and today, all eyes are on Celestia (TIA). This innovative crypto asset has been making waves, and for good reason! Over the past 24 hours, the price of Celestia (TIA) has jumped by a significant 4.44%, reaching $17.76. But that’s not all – this surge is part of a larger, more impressive trend. Let’s dive into what’s fueling this upward momentum and what it means for investors and the broader crypto landscape.
Celestia’s Consistent Climb: A Week of Gains
Looking beyond the daily fluctuations, Celestia’s performance over the last week is even more compelling. TIA has experienced a robust 14.0% price increase, climbing from $15.6 to its current level. This consistent upward trajectory signals strong market interest and growing confidence in Celestia. But what’s driving this positive trend?
See Also: Price Analysis: The Price Of Aptos (APT) Increased More Than 5% Within 24 Hours
Chasing the All-Time High: Can TIA Break Through?
Currently, Celestia is trading tantalizingly close to its all-time high of $20.16. This begs the question: will TIA surpass this milestone? The recent price action suggests it might be within reach. As the coin gains momentum, investors are watching closely to see if it can break through this resistance level and set a new record.
Decoding the Charts: Price Movement and Volatility
To understand Celestia’s price dynamics better, let’s examine the charts. The following visuals provide a comparative view of TIA’s price movement and volatility over the past 24 hours versus the last week. These charts are essential tools for traders and investors to gauge risk and potential opportunities.
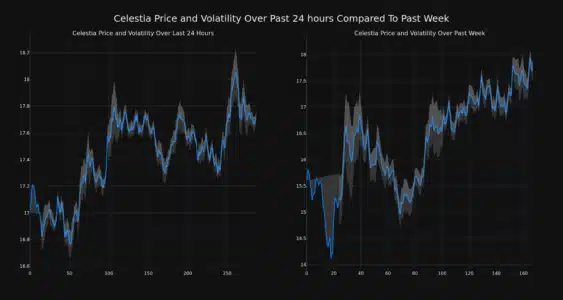
Bollinger Bands: Gauging Market Swings
The gray bands you see in the charts are Bollinger Bands. These are volatility indicators that help us understand the degree of price fluctuation. Essentially, Bollinger Bands measure how much the price of TIA is moving around its average. Wider bands indicate higher volatility, meaning the price is swinging more dramatically. Conversely, narrower bands suggest lower volatility and more stable price movement.
In the context of Celestia, analyzing the Bollinger Bands on both the daily and weekly charts can provide insights into whether the current price increase is accompanied by heightened risk or if it’s a more steady and potentially sustainable climb.
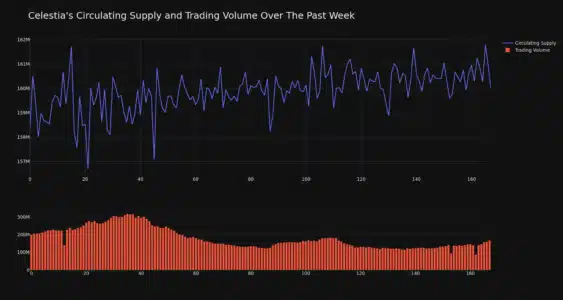
Trading Volume and Circulating Supply: Key Indicators
While the price of TIA is on the rise, it’s interesting to note that the trading volume has actually decreased by 16.0% over the past week. A decrease in trading volume alongside a price increase can sometimes be interpreted in different ways. It could suggest that the price rise is driven by fewer, but stronger, hands, or it might indicate a potential lack of broader market participation at these higher price levels. It’s a metric worth keeping an eye on.
On the other hand, the circulating supply of TIA has seen a slight increase of 1.05% in the last week. Understanding circulating supply is crucial as it directly impacts market capitalization and potential inflation. A rising circulating supply means more TIA tokens are available in the market.
Current Circulating Supply and Market Cap
This increase brings the total circulating supply of TIA to 160.77 million tokens. With the recent price surge, Celestia’s market capitalization has reached $2.85 billion, securing its position at #33 in the overall cryptocurrency rankings. Market cap is a vital metric as it reflects the total value of a cryptocurrency and its relative size within the market.
What’s Next for Celestia (TIA)?
Celestia’s recent price performance is undoubtedly noteworthy. The 14% weekly gain and the approach towards its all-time high are attracting attention. However, as with any cryptocurrency, volatility and market dynamics can shift rapidly. Factors that could be influencing TIA’s price include:
- Overall Market Sentiment: The broader crypto market trends and Bitcoin’s performance often have a ripple effect on altcoins like Celestia.
- Project Developments: Any significant updates, partnerships, or technological advancements within the Celestia ecosystem could boost investor confidence.
- Demand and Adoption: Increased adoption of Celestia’s technology and network can drive demand for TIA tokens.
- Speculative Trading: Market speculation and trading activities can also contribute to short-term price fluctuations.
Final Thoughts: Riding the TIA Wave?
Celestia (TIA) is showcasing strong upward momentum, and its recent price surge is capturing the crypto community’s interest. While the reduced trading volume warrants observation, the consistent weekly gains and the approach to the all-time high paint a positive picture. As always, the cryptocurrency market is dynamic and requires careful monitoring. Investors should conduct thorough research and consider their risk tolerance before making any decisions regarding TIA or any other digital asset.
Disclaimer: The information provided is not trading nor financial advice. Bitcoinworld.co.in holds no liability for any trading or investments made based on the information provided on this page. We strongly recommend independent research and/or consultation with a qualified professional before making any trading or investment decisions.
Disclaimer: The information provided is not trading advice, Bitcoinworld.co.in holds no liability for any investments made based on the information provided on this page. We strongly recommend independent research and/or consultation with a qualified professional before making any investment decisions.