

Navigating the volatile world of cryptocurrency can feel like riding a rollercoaster. Recently, Polkadot (DOT), a popular cryptocurrency known for its interoperability, has experienced a noticeable dip. Let’s dive into the recent price movements of DOT and understand what’s been happening.
Polkadot (DOT) Price Decline: A Closer Look
Over the past day, the price of Polkadot (DOT) has decreased by 4.95%, bringing it down to $7.11. This downward trend isn’t isolated to just the last 24 hours. Looking back at the past week, DOT has seen a significant 16.0% loss, falling from $8.45 to its current price point. This consistent decline warrants a closer examination to understand the factors at play.
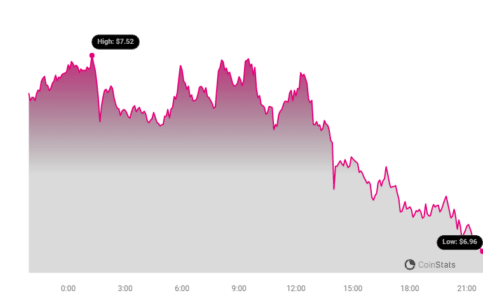
The chart above visually represents DOT’s price fluctuations. You can clearly see the recent negative movement in price, highlighting the selling pressure the cryptocurrency is currently facing.
Volatility Check: How Much is Polkadot’s Price Swinging?
To better understand the intensity of these price movements, let’s consider volatility. Volatility measures how much the price of an asset fluctuates over time. The chart below helps us visualize DOT’s volatility over both a 24-hour period and the past week.
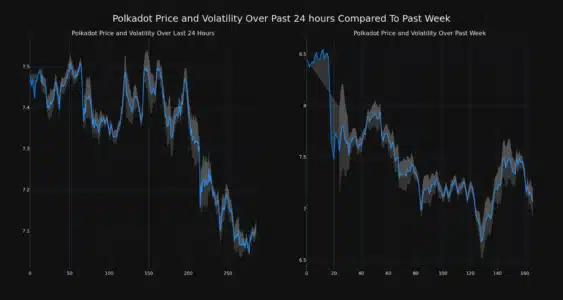
In these charts, the gray bands represent Bollinger Bands. Bollinger Bands are a technical analysis tool used to measure volatility. Essentially, wider bands indicate higher volatility, meaning the price is swinging more dramatically. Conversely, narrower bands suggest lower volatility with less price fluctuation.
See Also: Bitcoin Price Tested $47k As Trading Volume Soars Nearly 120%
By observing the Bollinger Bands, we can gauge the degree of price fluctuation in DOT over different timeframes. This helps in understanding whether the recent price drops are accompanied by high or low volatility, providing further context to the market movement.
Trading Volume and Circulating Supply: What’s the Impact?
Beyond price and volatility, two other key metrics provide valuable insights into the health and momentum of a cryptocurrency: trading volume and circulating supply.
- Trading Volume: This represents the total amount of DOT coins that have been traded within a specific period. A decrease in trading volume can sometimes indicate waning interest or reduced market activity.
- Circulating Supply: This refers to the number of DOT coins that are currently available to be traded in the market. An increase in circulating supply can, under certain circumstances, exert downward pressure on price if demand doesn’t keep pace.
Let’s examine how these factors are currently influencing Polkadot.
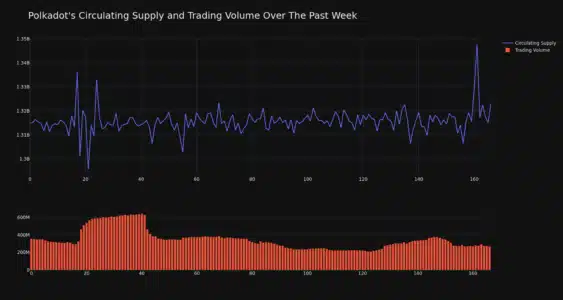
Data reveals that the trading volume for DOT has decreased by a significant 24.0% over the past week. This suggests reduced buying and selling activity compared to previous periods. Concurrently, the circulating supply of DOT has slightly increased by 0.65%. This brings the total circulating supply to 1.32 billion DOT coins.
Market Cap and Ranking: Where Does DOT Stand?
Despite the recent price downturn, Polkadot remains a significant player in the cryptocurrency market. Currently, DOT holds the #12 position in market capitalization rankings, with a market cap of $9.36 billion. Market capitalization is calculated by multiplying the circulating supply by the current price, providing a measure of the total market value of a cryptocurrency.
While a lower price can impact market cap, DOT’s continued ranking within the top cryptocurrencies indicates its established position and overall value within the crypto ecosystem.
In Summary: Understanding DOT’s Current Market Position
Polkadot (DOT) is currently experiencing a period of price decline, marked by a 4.95% drop in the last 24 hours and a 16.0% decrease over the past week. This is accompanied by decreased trading volume and a slight increase in circulating supply. While the price is down, DOT maintains a strong market cap and ranking, highlighting its continued relevance in the crypto space.
It’s crucial to remember that the cryptocurrency market is inherently volatile, and price fluctuations are a common occurrence. Analyzing factors like price movement, volatility, trading volume, and circulating supply provides a more comprehensive understanding of market dynamics. For investors and those interested in Polkadot, staying informed about these metrics is essential for navigating the crypto landscape.
Disclaimer: The information provided is not trading advice. Bitcoinworld.co.in holds no liability for any investments made based on the information provided on this page. We strongly recommend independent research and/or consultation with a qualified professional before making any investment decisions.
Disclaimer: The information provided is not trading advice, Bitcoinworld.co.in holds no liability for any investments made based on the information provided on this page. We strongly recommend independent research and/or consultation with a qualified professional before making any investment decisions.