
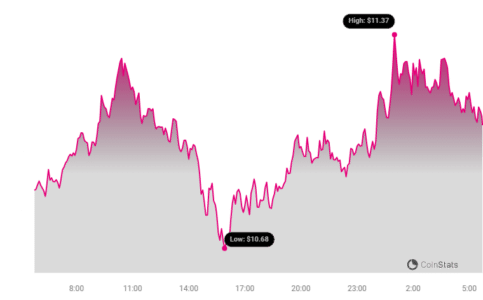
Hold onto your hats, crypto enthusiasts! The Polkadot (DOT) rollercoaster is on an upward swing again. Over the past 24 hours, DOT has shown impressive momentum, with its price climbing by a solid 3.09%. This surge has pushed DOT’s price to $11.01, sparking excitement and questions among investors and traders alike. Is this just a fleeting pump, or could it signal the beginning of a more sustained bullish trend for Polkadot? Let’s dive into the data and analyze what’s happening with DOT.
[/caption>
What’s Fueling Polkadot’s Recent Price Hike?
This 24-hour jump isn’t happening in isolation. Zooming out a bit, we see that Polkadot has been on a positive trajectory for the past week. In fact, DOT has gained a healthy 5.0% over the last seven days, rising from $10.39 to its current price point. This consistent upward movement suggests more than just a daily fluctuation; it hints at a potential shift in market sentiment towards Polkadot.
But what could be driving this renewed interest in DOT? While pinpointing exact reasons in the volatile crypto market is always tricky, here are a few potential factors:
- Broader Market Recovery: The cryptocurrency market often moves in waves. If Bitcoin and Ethereum are experiencing positive price action, it can create a ripple effect, lifting other altcoins like Polkadot. It’s worth checking the overall market sentiment to see if a general recovery is underway.
- Polkadot Ecosystem Developments: Keep an eye on news and announcements related to the Polkadot network itself. Are there any upcoming parachain auctions, significant partnerships, or technological upgrades? Positive developments within the Polkadot ecosystem can often translate to price appreciation.
- Increased Investor Interest: Sometimes, price movements are simply driven by increased buying pressure. This could be due to renewed interest from retail investors, institutional investors accumulating DOT, or a combination of both.
See Also: Price Analysis: The Price Of Solana (SOL) Increased More Than 8% Within 24 Hours
While the current price is encouraging, it’s important to remember that DOT is still significantly below its all-time high of $54.98. This peak price, achieved in previous market cycles, serves as a reminder of the potential upside – and the distance DOT still needs to cover to reach those levels again.
Analyzing Polkadot’s Price Dynamics: Volatility and Trends
To get a more comprehensive picture, let’s delve into Polkadot’s price charts and understand its recent behavior. The charts below provide a visual comparison of DOT’s price movement and volatility over the last 24 hours versus the past week.
[caption id="attachment_68098" align="aligncenter" width="706"]
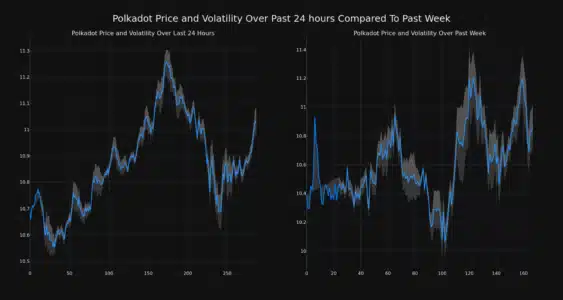 Polkadot Price and Volatility Chart
[/caption>
Decoding Bollinger Bands: Gauging Volatility
Notice those gray bands on the charts? Those are Bollinger Bands, a popular technical analysis tool used to measure volatility. Essentially, Bollinger Bands show the range within which a cryptocurrency’s price typically fluctuates.
Here’s how to interpret them:
- Wider Bands = Higher Volatility: When the bands widen, or the gray area expands, it indicates increased price volatility. This means the price is swinging more dramatically.
- Narrower Bands = Lower Volatility: Conversely, narrower bands suggest lower volatility, with price movements being less erratic.
By observing the Bollinger Bands on the charts, you can get a sense of whether Polkadot’s price action is becoming more or less volatile in both the short-term (24 hours) and the medium-term (week).
Key Market Indicators: Trading Volume and Circulating Supply
Beyond price and volatility, other metrics provide valuable insights into Polkadot’s market health. Let’s look at trading volume and circulating supply.
[caption id="attachment_68096" align="aligncenter" width="713"]
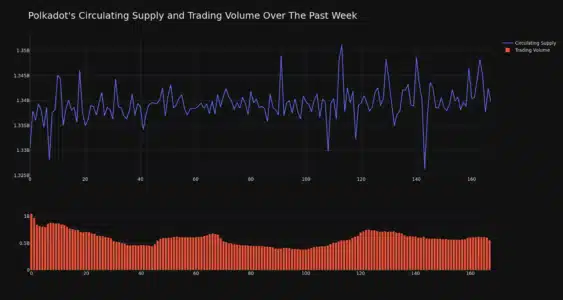 Polkadot Circulating Supply and Trading Volume
Trading Volume: A Dip in Activity
Interestingly, while the price has increased, the trading volume for DOT has actually decreased by 47.0% over the past week. This might seem counterintuitive at first. A decrease in trading volume during a price increase can sometimes suggest:
- Less Conviction: The price increase might be driven by fewer, but larger, trades, rather than widespread buying activity. Lower volume can sometimes indicate less broad-based conviction in the upward trend.
- Potential for Volatility: Lower liquidity (due to lower volume) can sometimes make the price more susceptible to sudden swings, both upwards and downwards.
Circulating Supply: A Slight Increase
On the supply side, the circulating supply of DOT has increased slightly by 0.71% in the last week, now standing at over 1.34 billion coins. A gradual increase in circulating supply is generally expected in many cryptocurrencies as part of their tokenomics and staking/rewards mechanisms. However, significant and rapid increases in supply could potentially exert downward pressure on price over time.
Polkadot’s Market Standing: A Top Contender
Despite market fluctuations, Polkadot remains a significant player in the cryptocurrency landscape. Currently, DOT holds the #14 market cap ranking, with a market capitalization of $14.78 billion. This ranking highlights Polkadot’s position as a leading cryptocurrency project with substantial market value and investor interest. Its innovative technology, focused on interoperability and scalability, continues to attract attention within the blockchain space.
Disclaimer: The information provided is not trading advice. Bitcoinworld.co.in holds no liability for any investments made based on the information provided on this page. We strongly recommend independent research and/or consultation with a qualified professional before making any investment decisions.
In Conclusion: Is Polkadot’s Upswing Here to Stay?
Polkadot’s recent 3% price surge in 24 hours, coupled with a 5% gain over the week, is undoubtedly positive news for DOT holders. However, it’s crucial to remember that the cryptocurrency market is inherently volatile. While the upward momentum is encouraging, the decrease in trading volume warrants cautious observation.
Key Takeaways:
- Polkadot (DOT) price increased by 3.09% in the last 24 hours and 5% over the past week.
- Current DOT price is around $11.01.
- Trading volume has decreased, which could indicate lower conviction or increased volatility risk.
- Circulating supply has slightly increased.
- DOT remains a top 15 cryptocurrency by market capitalization.
What’s Next? Keep a close eye on broader market trends, developments within the Polkadot ecosystem, and trading volume in the coming days and weeks. Will DOT sustain this upward trend? Only time will tell. Always conduct thorough research and consider your risk tolerance before making any investment decisions in the cryptocurrency market.
#Binance #WRITE2EARN
Disclaimer: The information provided is not trading advice, Bitcoinworld.co.in holds no liability for any investments made based on the information provided on this page. We strongly recommend independent research and/or consultation with a qualified professional before making any investment decisions.