Cryptocurrency markets are known for their rollercoaster rides, and Ripple (XRP) is no exception. Just when you thought XRP was settling into a downward trajectory, the digital asset has surprised traders with a notable 4.1% jump in the last 24 hours, pushing its price to $0.53. But is this a sign of a sustained recovery, or just a temporary breather in a larger downtrend? Let’s dive into the latest price analysis for XRP and explore what these movements could mean for investors.
XRP’s Price Surge: A 24-Hour Snapshot
After a week of bearish sentiment, XRP bulls seem to have stepped in. The price chart below illustrates this recent uptick, showcasing a clear positive movement over the last day.
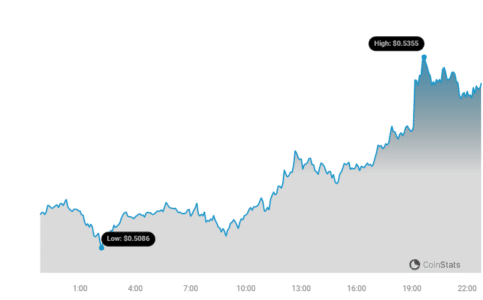
This 4.1% rise is a welcome change from the past week’s performance, where XRP dipped by 3.0%, sliding from $0.54 to its current level. While this daily gain is encouraging, it’s essential to remember that XRP is still trading significantly below its all-time high of $3.40. The question on every investor’s mind is: Can XRP regain its previous peaks?
See Also: Price Analysis: The Price of Monero (XMR) Rises More Than 3% In 24 hours
Volatility Check: Daily vs. Weekly Price Swings
To understand the bigger picture, it’s crucial to analyze XRP’s volatility. Volatility essentially measures how much the price of an asset fluctuates over time. Higher volatility means greater price swings, which can present both opportunities and risks for traders.
The charts below use Bollinger Bands to visualize XRP’s volatility over the past 24 hours and the last week. Let’s break down what these bands tell us:
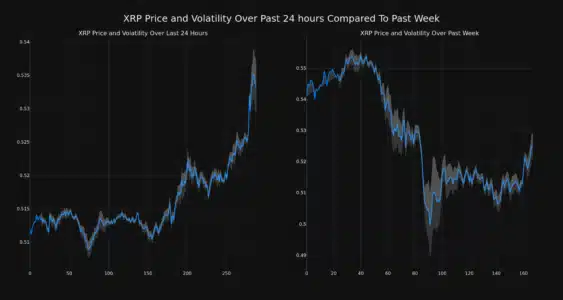
Understanding Bollinger Bands:
- Gray Bands: These are Bollinger Bands, a popular technical analysis tool. They consist of a middle band (typically a 20-day simple moving average) and upper and lower bands that are a certain number of standard deviations away from the middle band.
- Volatility Indicator: The width of the Bollinger Bands reflects volatility. Wider bands indicate higher volatility, meaning the price is experiencing larger fluctuations. Conversely, narrower bands suggest lower volatility and more stable price movement.
Looking at the charts, we can observe the comparative volatility of XRP over the daily and weekly periods. By visually assessing the width of the gray bands, traders can get a sense of whether XRP’s price action is becoming more or less erratic.
Trading Volume and Circulating Supply: Key Indicators
Beyond price and volatility, trading volume and circulating supply are critical metrics for assessing the health and momentum of a cryptocurrency. Let’s examine XRP’s performance in these areas:
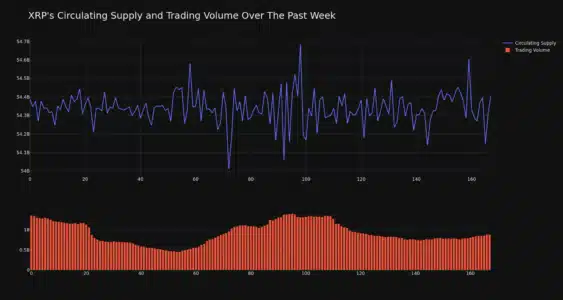
Key Observations:
- Trading Volume Decline: The data reveals a significant 35.0% decrease in XRP’s trading volume over the past week. A drop in trading volume can sometimes indicate waning interest or caution among investors. It’s important to monitor if this trend continues, as sustained low volume can sometimes precede further price corrections.
- Circulating Supply Increase: Interestingly, the circulating supply of XRP has slightly increased by 0.04% over the last week. While seemingly small, an increase in circulating supply can, in theory, exert downward pressure on price if demand doesn’t keep pace.
- Current Circulating Supply: The circulating supply now stands at 54.37 billion XRP.
- Percentage of Max Supply: This circulating supply represents approximately 54.37% of XRP’s total maximum supply of 100.00 billion coins.
XRP’s Market Position: #6 and Holding
Despite the recent price fluctuations and volume dip, XRP maintains a strong position in the cryptocurrency market rankings. Currently, XRP holds the #6 spot in market capitalization, boasting a market cap of $29.02 billion. This ranking underscores XRP’s significant presence and established position within the crypto ecosystem. Market capitalization is a crucial metric as it reflects the total value of a cryptocurrency and often influences investor perception and institutional interest.
In Conclusion: Is XRP’s Rise Sustainable?
XRP’s 4.1% price rise in the last 24 hours offers a glimmer of hope for investors after a week of negative price action. However, the decrease in trading volume and the slight increase in circulating supply warrant attention. Whether this recent surge marks the beginning of a more sustained upward trend or is merely a temporary bounce remains to be seen.
For traders and investors, keeping a close watch on XRP’s price movements, volatility indicators like Bollinger Bands, trading volume, and broader market sentiment will be crucial in the coming days and weeks. As always, the cryptocurrency market is dynamic and requires diligent research and informed decision-making.
Disclaimer: The information provided is not trading nor financial advice. Bitcoinworld.co.in holds no liability for any trading or investments made based on the information provided on this page. We strongly recommend independent research and/or consultation with a qualified professional before making any trading or investment decisions.
Disclaimer: The information provided is not trading advice, Bitcoinworld.co.in holds no liability for any investments made based on the information provided on this page. We strongly recommend independent research and/or consultation with a qualified professional before making any investment decisions.