

Stellar Lumen (XLM) holders, are you watching the charts closely? The cryptocurrency market can be a rollercoaster, and recently, XLM has experienced a significant dip. If you’re tracking XLM’s price movements, you’ve probably noticed it slipped below a critical support level. Let’s dive into what’s happening with Stellar Lumen’s price and what the technical indicators are suggesting for the near future.
XLM Price Plunge: What Happened?
In recent trading sessions, Stellar Lumen (XLM) has struggled to maintain its position above the $0.12 mark against the US Dollar. After failing to break through the $0.1220 resistance, XLM faced a fresh wave of selling pressure, mirroring the broader market sentiment and even Bitcoin’s movements. This downward momentum pushed XLM below several key levels, prompting concerns among investors. Let’s break down the critical points:
- Breaching Support: XLM’s price decisively broke below the $0.120 support zone, a level that previously acted as a buffer against further declines.
- Moving Averages Breakdown: The price now trades below $0.120 and also sits under the 55 simple moving average on the 4-hour chart. This is often seen as a bearish signal by technical analysts, indicating potential further downside.
- Declining Channel Formation: A key declining channel is forming on the 4-hour chart, with resistance around $0.1180. This pattern suggests that selling pressure is persistent, and upward movements might face hurdles at this resistance level.
- Potential for Further Decline: Technical analysis suggests that if XLM fails to regain momentum, it could potentially slide further, possibly testing or even breaking below the $0.1115 support zone in the short term.
Essentially, XLM is navigating choppy waters, and understanding these technical signals is crucial for anyone tracking this cryptocurrency.
Deeper Dive into XLM’s Price Action
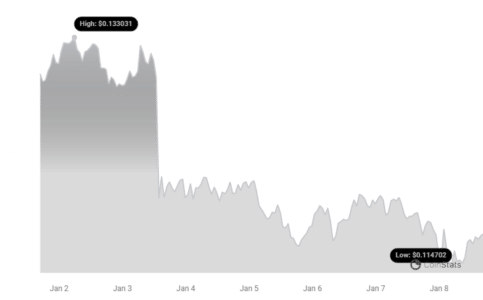
Looking closer at the recent price action, we can see that after struggling to overcome the $0.1220 resistance, sellers took control. The drop wasn’t gradual; it accelerated past the $0.1200 and $0.1180 marks, indicating strong bearish momentum. The price even dipped below $0.1150 before finding a temporary low around $0.1116. Currently, XLM is in a consolidation phase, attempting to stabilize after this sharp decline. However, the presence of the declining channel with resistance at $0.1180 suggests that the path to recovery might not be straightforward.
See Also: Solana Price Analysis: SOL Plunged 12% in A Week
Currently, XLM is trading below the $0.120 mark and the 55-period simple moving average on the 4-hour chart. The immediate resistance to watch is near the $0.1180 level. This level is also close to the 23.6% Fibonacci retracement of the recent downward move from the $0.1383 swing high down to the $0.1116 low. This Fibonacci level often acts as a potential resistance point in a downtrend.
On the upside, the next significant resistance is around $0.1220. A decisive break above this level could signal a potential shift in momentum, possibly pushing the price towards $0.1250 and beyond. Further gains could then target the $0.128 level, which aligns with the 61.8% Fibonacci retracement level of the same downward move. This 61.8% level is often considered a key retracement point in technical analysis.
However, if XLM fails to overcome the $0.1180 and $0.1220 resistance levels, the downtrend might persist. Initial support on the downside is near $0.1142.
The next major support level is at $0.1115. A break below this level could open the door for further losses towards $0.1100 and potentially even $0.1050 in the near term. The price chart pattern, as highlighted, reinforces the bearish sentiment with XLM trading below the $0.120 level and the 55 simple moving average on the 4-hour timeframe.
In summary, while the current trend is bearish, a break above the $0.122 resistance could be the catalyst for a fresh upward move. However, until that happens, caution might be warranted.
Key Technical Indicators to Watch
For traders and investors, keeping an eye on technical indicators can provide valuable insights. Here’s a quick rundown of the key indicators for XLM/USD:
- 4-Hour MACD: The Moving Average Convergence Divergence (MACD) on the 4-hour chart is currently gaining bearish momentum. This suggests that the downward trend might still have strength.
- 4-Hour RSI: The Relative Strength Index (RSI) on the 4-hour chart is below the 50 level. An RSI below 50 typically indicates bearish momentum, suggesting that sellers have more control.
- Key Support Levels: Crucial support levels to watch are at $0.1142 and $0.1115. These are levels where buying interest might emerge and potentially halt further declines.
- Key Resistance Levels: On the upside, key resistance levels are at $0.1180, $0.1220, and $0.1280. Breaking above these levels would be necessary to signal a potential trend reversal.
In a Nutshell: XLM’s Next Move?
Stellar Lumen (XLM) is currently facing downward pressure, having broken below the $0.12 support. Technical indicators suggest continued bearish momentum in the short term. However, the cryptocurrency market is known for its volatility, and things can change quickly. Keep an eye on the key resistance levels mentioned. A break above $0.1220 could be an early sign of a potential recovery. Conversely, failure to hold above $0.1115 could lead to further downside.
Disclaimer: The information provided is not trading advice. Bitcoinworld.co.in holds no liability for any investments made based on the information provided on this page. We strongly recommend independent research and/or consultation with a qualified professional before making any investment decisions.
Disclaimer: The information provided is not trading advice, Bitcoinworld.co.in holds no liability for any investments made based on the information provided on this page. We strongly recommend independent research and/or consultation with a qualified professional before making any investment decisions.