Cryptocurrency enthusiasts, buckle up! The TRON (TRX) market is buzzing with activity as the price of TRX has experienced a notable surge. In the past 24 hours alone, TRON’s price has jumped by 3.4%, reaching $0.11. But what’s fueling this upward momentum, and is this just a fleeting spike or the start of a more sustained rally? Let’s dive into a detailed analysis of TRON’s recent price action, market dynamics, and what it could mean for investors.
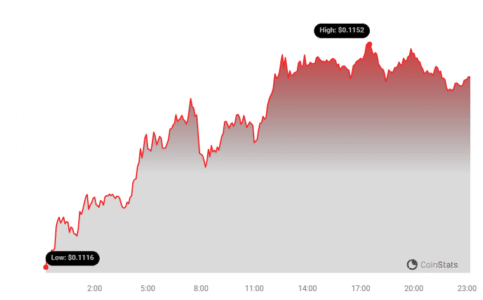 TRON Price Chart | Source: Coinstats
[/caption>
TRX Price Momentum: A Week in Review
Looking at the bigger picture, TRON’s positive price movement isn’t just a 24-hour phenomenon. Over the last week, TRX has demonstrated impressive growth, climbing over 5.0% from $0.11 to its current price point. This consistent upward trend is definitely catching the attention of traders and investors alike. It’s worth noting that TRON still has room to grow to reach its all-time high of $0.23, set in the bullish market peaks of the past. Could this recent surge be a sign of TRX gearing up to challenge those previous highs?
See Also: Price Analysis: The Price Of Cardano (ADA) Up More Than 4% In 24 Hours
Decoding TRON’s Price Volatility and Movement
To understand the nuances of TRON’s price action, let’s examine its price movement and volatility. The charts below provide a visual representation of TRX’s price fluctuations over the past 24 hours (left) and the past week (right). These charts are invaluable tools for understanding the risk and potential reward associated with trading TRX.
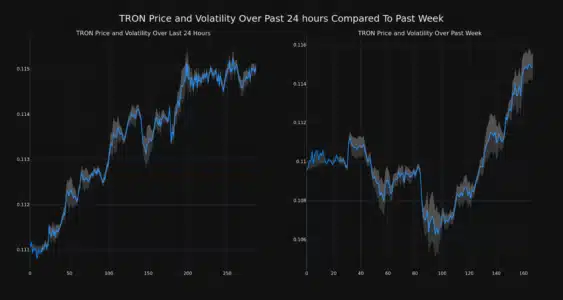 TRON Price and Volatility Chart
[/caption>
Notice the gray bands in the charts? These are Bollinger Bands, a popular technical analysis indicator used to measure volatility. Bollinger Bands help us visualize how much the price of TRX is fluctuating around its average price.
Understanding Bollinger Bands:
- Wider Bands = Higher Volatility: When the Bollinger Bands widen, it indicates increased price volatility. This means the price of TRX is swinging more dramatically, presenting both potential opportunities for profit and increased risk of losses.
- Narrower Bands = Lower Volatility: Conversely, when the bands narrow, it suggests lower volatility and more stable price movement.
By observing the Bollinger Bands, traders can gain insights into potential price breakouts or periods of consolidation for TRON.
Trading Volume and Circulating Supply: Key Market Indicators
Beyond price and volatility, trading volume and circulating supply are crucial metrics for understanding the health and momentum of any cryptocurrency. Let’s take a look at these for TRON:
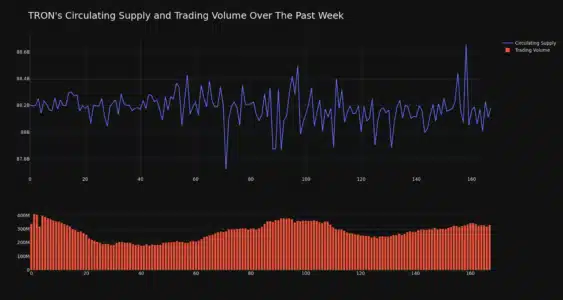 TRON Circulating Supply and Trading Volume Chart
[/caption>
Interestingly, the trading volume for TRX has decreased by 2.0% over the past week. This decrease is moving in the same direction as the circulating supply of TRX, which has slightly decreased by 0.03%.
What does this mean?
- Decreasing Trading Volume: A drop in trading volume could sometimes indicate waning interest or consolidation in the market after a price move. However, it’s important to consider this in context with other market indicators.
- Slightly Decreased Circulating Supply: A minor decrease in circulating supply is generally not a significant factor in short-term price movements but is something to monitor over the long term.
Currently, the circulating supply of TRX stands at 88.16 billion coins.
TRON’s Market Cap and Ranking
As of now, TRON holds the #12 position in the cryptocurrency market cap rankings, boasting a market capitalization of $10.14 billion. This ranking signifies TRON’s significant presence and market value within the broader crypto ecosystem. A strong market cap often suggests greater stability and liquidity compared to lower-ranked cryptocurrencies.
Key Takeaways and Actionable Insights for TRX Investors
So, what can we conclude from this recent analysis of TRON’s price surge?
- Positive Price Momentum: TRON (TRX) is exhibiting positive price momentum in both the short-term (24 hours) and medium-term (past week).
- Volatility Awareness: While the price is rising, traders should remain aware of the volatility inherent in cryptocurrency markets, as indicated by the Bollinger Bands. Manage risk accordingly.
- Monitor Trading Volume: Keep an eye on trading volume trends. A sustained increase in volume alongside price increases could signal stronger bullish momentum.
- Market Cap Strength: TRON’s solid market cap ranking suggests a relatively established position in the crypto market.
Is the TRON Uptrend Sustainable?
Predicting the future of cryptocurrency prices is notoriously difficult. While TRON is currently experiencing a price rise, several factors could influence its sustainability. These include overall market sentiment, broader cryptocurrency market trends (like Bitcoin’s performance), developments within the TRON ecosystem, and adoption rates of TRON’s blockchain platform.
For Investors: It’s crucial to conduct thorough research and consider your own risk tolerance before making any investment decisions. Keep track of news and developments related to TRON and the wider crypto market to stay informed.
Disclaimer: The information provided is not trading nor financial advice. Bitcoinworld.co.in holds no liability for any trading or investments made based on the information provided on this page. We strongly recommend independent research and/or consultation with a qualified professional before making any trading or investment decisions.
Disclaimer: The information provided is not trading advice, Bitcoinworld.co.in holds no liability for any investments made based on the information provided on this page. We strongly recommend independent research and/or consultation with a qualified professional before making any investment decisions.