Buckle up, crypto enthusiasts! The market is buzzing with activity, and XRP is stealing the spotlight. Over the past 24 hours, Ripple’s XRP has experienced a significant surge, jumping by a whopping 19.01% to reach a price of $0.73. This impressive rally has sparked considerable interest and discussion within the crypto community. Let’s dive into the details of this price movement and explore what might be fueling this bullish momentum for XRP.
XRP Price Performance: A Closer Look
The recent price action of XRP has been nothing short of remarkable. Take a look at the chart below to visualize the surge:
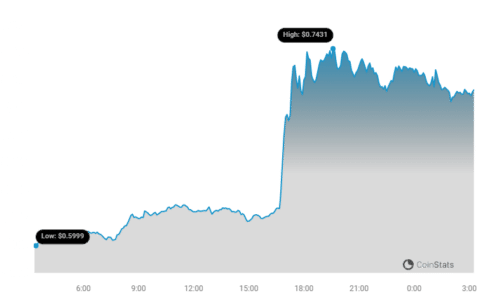
As you can see, the upward trend is quite pronounced. But it’s not just a 24-hour phenomenon. Looking at the bigger picture, XRP has been on an upward trajectory for the past week as well. In the last seven days, the price has climbed over 13.0%, moving from $0.65 to its current level. This sustained growth indicates a strong bullish sentiment surrounding XRP in the recent period.
While $0.73 is a significant milestone, it’s important to remember XRP’s historical peaks. The coin’s all-time high stands at $3.40. This historical context provides perspective on XRP’s potential and the distance it still needs to cover to reach its previous zenith.
See Also: Price Analysis: Litecoin (LTC) Price Increased More Than 18% Within 24 Hours
Decoding XRP’s Volatility and Price Swings
To better understand the dynamics of XRP’s price movement, let’s examine its volatility. Volatility is a key indicator of how much and how quickly the price of an asset fluctuates. The chart below provides a comparative view of XRP’s price movement and volatility over the past 24 hours versus the past week:
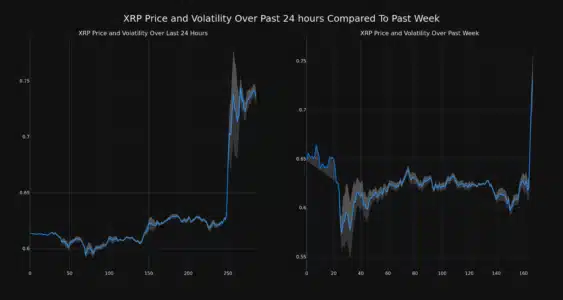
In these charts, the gray bands represent Bollinger Bands. Bollinger Bands are a technical analysis tool used to measure the volatility of an asset’s price. They essentially show a range within which the price typically fluctuates.
Understanding Bollinger Bands:
- Wider Bands = Higher Volatility: When the Bollinger Bands are wide, or the gray area is large, it indicates higher volatility. This means the price is experiencing larger and more rapid swings.
- Narrower Bands = Lower Volatility: Conversely, narrower bands suggest lower volatility, implying more stable price movements.
By observing the Bollinger Bands in the charts, we can get a sense of the degree of price fluctuation XRP has experienced recently. Analyzing these bands in conjunction with the price charts can provide valuable insights into the momentum and potential risks associated with XRP trading.
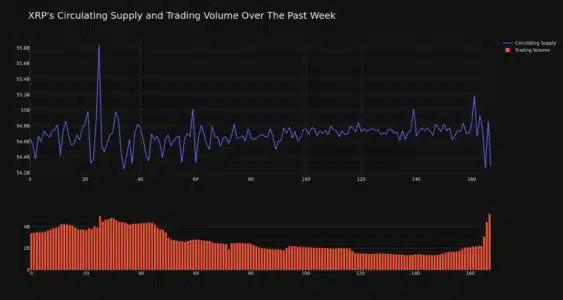
Trading Volume and Circulating Supply: Key Indicators
Beyond price and volatility, two other crucial metrics to consider are trading volume and circulating supply. These factors can offer further clues about the strength and sustainability of XRP’s price surge.
Trading Volume Surge:
Interestingly, the trading volume for XRP has seen a significant increase, jumping by 53.0% over the past week. This surge in trading volume often accompanies price increases, suggesting heightened market activity and interest in XRP. Increased volume can be an indicator of stronger conviction behind a price movement.
Circulating Supply Dynamics:
On the other hand, the overall circulating supply of XRP has experienced a slight decrease of 0.67% over the past week. While seemingly small, changes in circulating supply can influence price dynamics. A decrease in circulating supply, assuming demand remains constant or increases, can potentially exert upward pressure on the price.
Let’s visualize the circulating supply and trading volume trends:
XRP’s Market Position and Supply Metrics
Currently, XRP’s circulating supply is estimated to be 54.74% of its maximum supply, which is capped at 100.00 billion XRP. This means that roughly half of the total potential XRP supply is currently in circulation.
In terms of market capitalization, XRP holds a prominent position in the cryptocurrency rankings. Its current market cap ranking is #6, with a market capitalization of $40.64 billion. This robust market cap underscores XRP’s significance and established presence within the crypto ecosystem.
What’s Driving the XRP Rally? (Speculative Factors)
While the provided data focuses on price movements and market metrics, it’s natural to wonder what factors might be contributing to this recent XRP surge. While we can only speculate without specific news or announcements in this article, some common drivers in the crypto market could be at play:
- Positive Market Sentiment: Broader positive sentiment in the cryptocurrency market can often lift the prices of various cryptocurrencies, including XRP.
- Whale Activity: Large transactions or accumulation by whales (large holders of cryptocurrency) can sometimes trigger price rallies.
- Technological Developments or Partnerships: Announcements related to Ripple’s technology, partnerships, or adoption could boost investor confidence.
- Speculation and FOMO (Fear of Missing Out): Price increases themselves can sometimes create a feedback loop, attracting more buyers driven by speculation and FOMO.
It’s important to note that these are speculative factors. A deeper investigation into recent news and on-chain data would be needed to pinpoint the exact catalysts behind this specific XRP price surge.
Important Disclaimer
Disclaimer: The information provided is not trading advice. Bitcoinworld.co.in holds no liability for any investments made based on the information provided on this page. We strongly recommend independent research and/or consultation with a qualified professional before making any investment decisions.
#Binance #WRITE2EARN
In Conclusion: Riding the XRP Wave with Caution
XRP’s impressive 19% price surge in 24 hours and 13% weekly gain has undoubtedly captured the attention of the crypto market. Analyzing price charts, volatility, trading volume, and circulating supply provides valuable insights into the dynamics of this movement. While the current momentum is bullish, it’s crucial to remember the inherent volatility of the cryptocurrency market. Always conduct thorough research and consider seeking professional financial advice before making any investment decisions. Keep a close eye on market developments and stay informed to navigate the exciting, yet often unpredictable, world of crypto trading!
Disclaimer: The information provided is not trading advice, Bitcoinworld.co.in holds no liability for any investments made based on the information provided on this page. We strongly recommend independent research and/or consultation with a qualified professional before making any investment decisions.