
Feeling the market heat up? You’re not alone! This week kicked off with a wave of optimism as both stock and crypto markets flashed green, mirroring a growing “risk-on” sentiment. After weeks of steady gains, the S&P 500 (SPX) is leading the charge, signaling that investors are feeling bullish. This positive vibe could be just the fuel crypto needs to break through key resistance levels. And with earnings season in full swing (11% of S&P 500 companies reporting this week!), expect volatility to ramp up. Buckle up, it’s going to be an interesting ride!
One particularly interesting development is the Grayscale Bitcoin Trust (GBTC). Recent legal wins for Grayscale have significantly narrowed the discount on GBTC, reaching levels not seen since 2021. What does this mean? Investors are increasingly betting on GBTC finally transforming into a spot Bitcoin ETF – a move that could unleash significant capital into the crypto market.
But what does all this mean for Bitcoin and your favorite altcoins? When bad news barely dents prices and good news sends them soaring past resistance, it’s a clear sign that the bears are losing their grip. Confidence is shifting, and an upward surge could be on the horizon. Let’s dive into the critical resistance levels that Bitcoin and key altcoins need to conquer to kickstart a real uptrend.
S&P 500 (SPX): Is the Stock Market Rally Sustainable?
The S&P 500 Index (SPX) faced a setback when it bounced off the 50-day simple moving average (SMA) at 4,401 on October 12th. However, the bears couldn’t push it below the crucial 4,325 support level. Let’s break down what the charts are telling us:
- Key Support Held: The inability of bears to break 4,325 is a positive sign for bulls.
- Moving Averages Converging: The 20-day exponential moving average (EMA) at 4,341 is flattening, and the Relative Strength Index (RSI) is just above 50. This suggests a potential power shift towards buyers.
- Resistance Zone Ahead: The immediate challenge is overcoming the resistance zone between the 50-day SMA and the downtrend line.
What’s Next for SPX?
- Bullish Scenario: If buyers can break through the 50-day SMA and downtrend line, it could signal the end of the corrective phase and potentially trigger further upward movement.
- Bearish Scenario: A reversal from the current level and a break below 4,325 would empower the bears and could lead to a retest of the 4,216 support.
U.S. Dollar Index (DXY): Will the Dollar’s Strength Continue?
The U.S. dollar index (DXY) saw a correction from its peak of 107.34 on October 3rd, dipping to the 20-day EMA ($106) around October 10th. In a typical uptrend, pullbacks to the 20-day EMA are often seen as buying opportunities. Let’s see if history repeats itself:
- EMA Bounce: Bulls indeed stepped in at the 20-day EMA, initiating a rebound.
- Resistance Looms: The next hurdle is the 107.34 – 108 resistance zone.
DXY Potential Paths:
- Bullish Breakout: If bulls conquer the 107.34-108 zone, we could witness a strong rally towards 111.
- Bearish Defense: Bears are likely to defend the overhead zone. A drop below 105.50 support could send the index down to the 50-day SMA ($104.81).
- Critical Support: The 50-day SMA is a crucial level for bulls to defend to maintain the uptrend. Failing to hold this could open the door to a deeper correction towards 103.
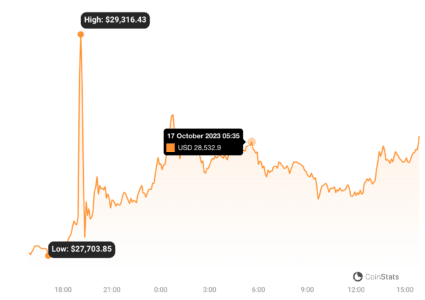
Bitcoin (BTC): Ready for the Next Leg Up?
Bitcoin (BTC) finally broke free from the tug-of-war between moving averages on October 16th, with bulls pushing the price above the 20-day EMA ($27,224). Was this the start of something bigger?
https://coinstats.app/coins/bitcoin/
- Momentum Spike: The initial breakout above the 20-day EMA was strong, propelling BTC/USDT above the $28,143 resistance.
- Resistance Rejection: However, bears quickly countered, aggressively selling at higher levels and pulling the price back below $28,143.
- Bullish Indicators: Despite the rejection, the 20-day EMA is turning upwards, and the RSI is in positive territory, giving bulls a slight advantage.
Bitcoin’s Key Levels to Watch:
- Bullish Target: A successful daily close above $28,143 could pave the way for a move towards $30,000 and potentially $31,000.
- Bearish Breakdown: Conversely, a break and close below the 50-day SMA ($26,715) would shift control to the bears, potentially leading to a drop to $26,000 and then $24,800.
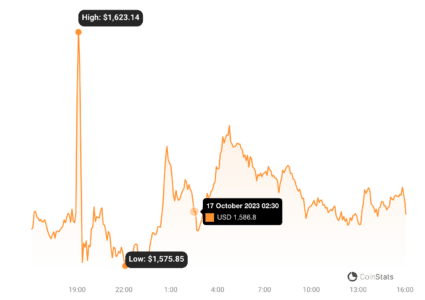
Ether (ETH): Will Range-Bound Trading Continue?
Ether (ETH) has been trapped in a range between $1,531 and $1,746 for quite some time. Range trading is all about buying low and selling high. Did the recent dip provide a buying opportunity?
https://coinstats.app/coins/ethereum/
- Support Bounce: Buyers indeed stepped in at $1,521 on October 12th, triggering a relief rally.
- Moving Average Resistance: Bulls attempted to push above the moving averages on October 16th, but strong selling pressure, indicated by the long wick on the candlestick, pushed back.
Ether’s Next Moves:
- Bearish Pressure: If the price turns down from the current level, bears will likely try again to push and hold ETH below $1,521, potentially leading to a collapse towards $1,368.
- Bullish Re-attempt: Bulls will need to regroup and try again to sustain a break above the moving averages to target the $1,746 resistance. Expect strong selling pressure at this upper range level.
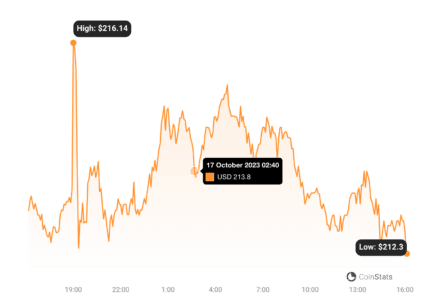
BNB: Is the Downtrend Losing Steam?
BNB showed resilience by bouncing off strong support at $203 and even briefly poked above the downtrend line on October 16th. Is this a sign of weakening bearish momentum?
https://coinstats.app/coins/binance-coin/
- Support Hold: The $203 support level is proving to be robust.
- Weakening Bearish Momentum: The 20-day EMA ($210) is flattening, and the RSI is above the midpoint, suggesting that selling pressure is easing.
- Downtrend Line Challenge: Bulls are attempting to break free from the downtrend line.
BNB Potential Scenarios:
- Bullish Invalidation: If bulls can push and hold BNB above the downtrend line, it would invalidate the bearish descending triangle pattern, potentially leading to rallies towards $235 and $250.
- Bearish Resurgence: A failure to hold above the downtrend line, followed by a drop below $203, would negate the bullish view and could trigger a tumble towards $183.
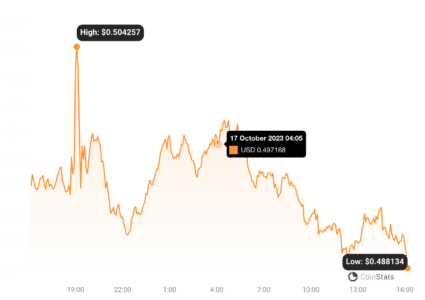
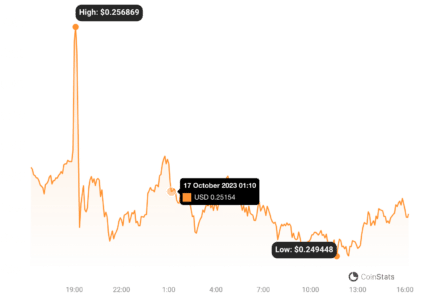
XRP: Stuck in a Range – Will it Break Free?
XRP continues to trade within a wide range of $0.41 to $0.56. Pullbacks are expected in range-bound markets, but are they sustainable?
https://coinstats.app/coins/ripple/
- Pullback Attempt: Bulls are trying to initiate a pullback, but moving averages are acting as immediate resistance.
- Selling on Rallies: If the price reverses from the moving averages, it would indicate that traders are selling into every minor rally, increasing the risk of a drop to $0.46.
XRP Price Trajectory:
- Bearish Continuation: Failure to hold $0.46 could lead to a further decline towards $0.41.
- Bullish Reversal: A successful push above the moving averages would signal strong buying interest and could trigger a rally towards the $0.56 resistance. Expect strong selling pressure at $0.56.
Solana (SOL): Bulls Flexing Their Muscles?
Solana (SOL) made a powerful move, breaking above the $22.50 resistance on October 16th. Is Solana leading the altcoin charge?
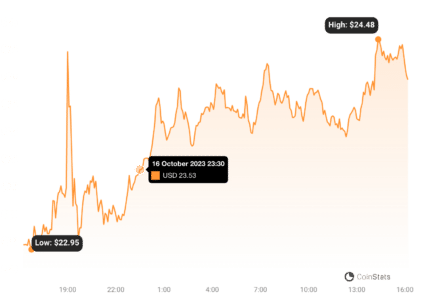
https://coinstats.app/coins/solana/
- Strong Breakout: The surge above $22.50 demonstrates significant bullish strength.
- Inverse Head and Shoulders Target: SOL is now challenging the neckline of an inverse head and shoulders pattern.
- Key Neckline Resistance: Breaking above this neckline is crucial for further gains.
Solana’s Potential:
- Bullish Breakout Confirmation: A close above the neckline would complete the bullish setup and could propel SOL/USDT towards $27.12 and potentially the pattern target of $32.81.
- Bearish Retaliation: Bears need to act quickly and push the price back below the 50-day SMA ($20.56) to negate the bullish momentum. Failure to hold the 50-day SMA could lead to a dip towards $18.50.
Cardano (ADA): Ready to Break Through Resistance?
Cardano (ADA) showed strong rebound from the $0.24 support, indicating strong buyer interest at this level. Can ADA overcome the moving average resistance?
https://coinstats.app/coins/cardano/
- Solid Support: The $0.24 level is holding strong as a support zone.
- Moving Average Hurdle: Moving averages are posing immediate resistance, although bulls attempted to break through on October 16th.
- Selling Pressure: The long wick on the candlestick indicates selling pressure at higher levels.
Cardano’s Path Forward:
- Bullish Momentum: If bulls can maintain momentum from current levels, a rally above $0.28 becomes increasingly likely. Breaking $0.28 could open the door to $0.30.
- Bearish Rejection: A price reversal from the moving averages would increase the likelihood of a drop below $0.24, potentially leading to declines towards $0.22 and $0.20.
Dogecoin (DOGE): Meme Coin Revival on the Horizon?
Dogecoin (DOGE) bounced back by reclaiming the $0.06 breakdown level on October 14th, suggesting buyers are attracted to lower prices. Is DOGE ready for another pump?
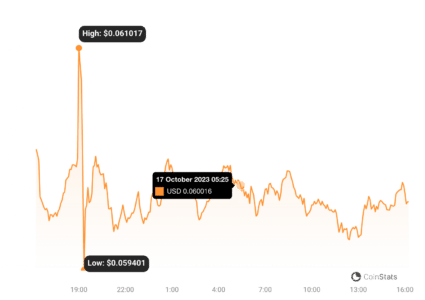
https://coinstats.app/coins/dogecoin/
- Breakdown Level Reclaimed: Recapturing $0.06 is a positive sign for DOGE bulls.
- Neutral Momentum: The 20-day EMA ($0.06) is flat, and the RSI is near the midpoint, indicating a potential balance between buyers and sellers.
Dogecoin Potential Scenarios:
- Bullish Breakout Attempt: If buyers can push and sustain DOGE above the moving averages, it could signal a new uptrend towards $0.07. Breaking $0.07 could lead to a further rally to $0.08.
- Range Consolidation: A price reversal from the current level suggests DOGE may continue to consolidate within the $0.055 to $0.06 range for a while longer.
Toncoin (TON): Bears in Control, But for How Long?
Toncoin (TON) has been trading below moving averages since October 12th. However, bears haven’t been able to push it significantly lower, indicating some underlying buying interest. Is a reversal brewing?
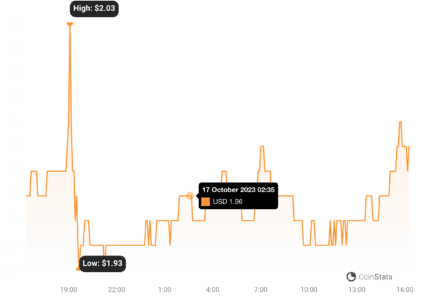
https://coinstats.app/coins/the-open-network/
- Below Moving Averages: TON is currently in a bearish position below the moving averages.
- Limited Downside: Bears haven’t been able to capitalize fully on this weakness, suggesting buyers are stepping in at lower levels.
- Resistance at Moving Averages: Bulls attempted to push back above the moving averages, but faced selling pressure.
Toncoin’s Key Levels:
- Bearish Pressure: Sellers may try to push TON below $1.89, potentially triggering a deeper correction towards $1.80 and $1.60.
- Bullish Comeback: To signal a bullish reversal, bulls need to push and hold TON above the moving averages, potentially leading to rallies towards $2.20 and $2.31.
Key Takeaways & Actionable Insights
- Risk-On Sentiment is Back: Both stock and crypto markets are showing positive momentum, fueled by risk appetite. Keep an eye on the S&P 500 for overall market direction.
- GBTC ETF Hype: Grayscale’s legal victories and narrowing GBTC discount suggest growing anticipation for a spot Bitcoin ETF, which could be a major catalyst for Bitcoin and the broader crypto market.
- Watch Key Levels: The price analysis highlights crucial support and resistance levels for BTC, ETH, BNB, XRP, SOL, ADA, DOGE, and TON. These levels can help you identify potential entry and exit points for trades.
- Volatility Expected: Earnings season will likely increase market volatility. Be prepared for potential price swings and manage your risk accordingly.
- Altcoin Opportunities: Solana (SOL) and Cardano (ADA) are showing strong bullish signals. Keep a close watch on their ability to break through resistance levels.
In Conclusion: Navigating the Green Shoots
The markets are showing signs of life, with a clear shift towards a risk-on environment. While challenges and resistance levels remain, the bullish momentum in both stocks and crypto is undeniable. Keep a close eye on the key levels discussed, stay informed about market developments, and remember to manage your risk wisely. The coming weeks could be pivotal in determining if this green start blossoms into a sustained market recovery.
Disclaimer: The information provided is not trading advice, Bitcoinworld.co.in holds no liability for any investments made based on the information provided on this page. We strongly recommend independent research and/or consultation with a qualified professional before making any investment decisions.