
Cryptocurrency markets are known for their thrilling volatility, and Injective (INJ) is currently delivering a captivating performance. Over the past 24 hours, the price of Injective has experienced a significant surge, jumping by an impressive 10.12% to reach $41.39. But what’s fueling this upward momentum, and can INJ sustain this bullish trend? Let’s dive into the details.
Injective (INJ) Price Performance: A Closer Look
The recent price action of Injective has certainly caught the attention of traders and investors alike. The 10% surge in the last day is not an isolated event. Looking at the bigger picture, INJ has demonstrated consistent growth over the past week.
- 24-Hour Price Surge: A notable 10.12% increase, pushing the price to $41.39.
- Weekly Uptrend: A solid 7.0% rise from $38.79 to the current price, indicating sustained positive momentum.
- Approaching All-Time High: Currently trading near its all-time high of $44.57, suggesting strong bullish sentiment and potential for further gains.
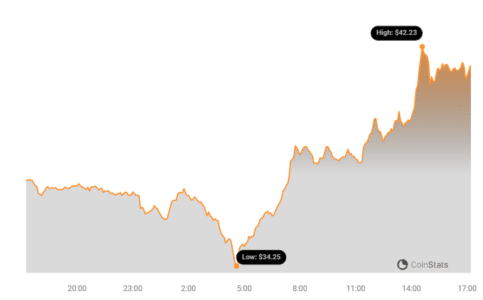
This price chart visually represents INJ’s recent climb. The upward trajectory clearly illustrates the positive price movement, making it easy to see the gains over the specified period.
Decoding INJ’s Volatility: What Do the Charts Tell Us?
To understand the dynamics of INJ’s price movement, examining volatility is crucial. Volatility essentially measures how much the price of an asset fluctuates over time. High volatility means prices can swing dramatically, while low volatility indicates more stable price action.
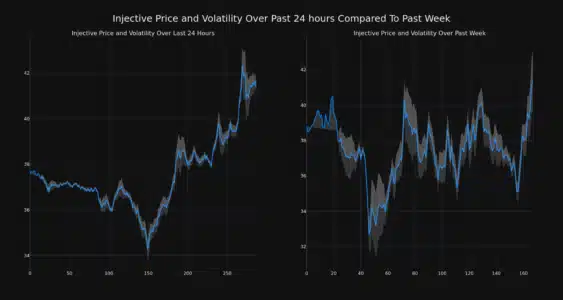
The following chart provides insights into Injective’s price movement and volatility over the past 24 hours and the last week. Bollinger Bands, represented by the gray bands in the chart, are a popular tool for measuring volatility.
Understanding Bollinger Bands:
- Volatility Indicator: Bollinger Bands expand and contract based on price volatility. Wider bands signify higher volatility, while narrower bands suggest lower volatility.
- Daily vs. Weekly Volatility: The chart compares daily (left) and weekly (right) volatility, allowing us to see short-term fluctuations versus longer-term trends.
- Gray Bands Interpretation: A wider gray area indicates higher volatility during that period.
By analyzing these bands, traders can gauge the risk associated with INJ and make more informed decisions. Periods of high volatility can present both opportunities and risks, requiring careful monitoring and strategy adjustments.
See Also: Price Analysis: The Price Of Internet Computer (ICP) Increased More Than 6% Within 24 Hours
Trading Volume and Circulating Supply: Key Indicators of Market Activity
Beyond price and volatility, trading volume and circulating supply are vital metrics to assess the health and momentum of a cryptocurrency.
- Trading Volume Surge: Injective’s trading volume has dramatically increased by 148.0% over the past week. This significant jump suggests heightened market interest and increased buying and selling activity.
- Circulating Supply Growth: The circulating supply of INJ has also seen a slight increase of 0.86% in the same period. This means a small number of new INJ tokens have entered the market.
- Directional Tandem: The increase in trading volume and circulating supply is moving in the same direction, indicating a healthy and organic growth pattern. Typically, increased demand (reflected in volume) can lead to a slight increase in circulating supply over time.
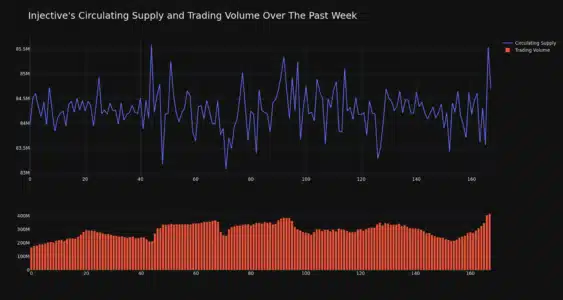
This chart illustrates the relationship between INJ’s circulating supply and trading volume. The concurrent upward movement of both lines visually confirms the positive correlation and growing market activity.
Injective’s Market Position: A Rising Star in DeFi
With a circulating supply now at 84.26 million INJ, Injective’s market capitalization stands at an impressive $3.48 billion. This places INJ at the #26 rank in the overall cryptocurrency market cap rankings.
What does this mean?
- Top 30 Crypto Asset: Ranking at #26 firmly positions Injective among the top-tier cryptocurrencies in the market, demonstrating significant market capitalization and investor confidence.
- Growing DeFi Ecosystem: Injective is a layer-1 blockchain built for finance, specializing in decentralized finance (DeFi) applications. Its rising market cap reflects the growing interest and adoption of DeFi solutions and the Injective ecosystem.
- Potential for Further Growth: As the DeFi sector continues to expand and Injective’s technology matures, there’s potential for INJ to climb even higher in the rankings.
Is the INJ Bull Run Sustainable? Looking Ahead
While the recent price surge and positive market indicators are encouraging for Injective, it’s essential to remember the cryptocurrency market’s inherent volatility. Predicting future price movements with certainty is impossible. However, understanding the underlying factors driving the current momentum is crucial for making informed decisions.
Factors to Consider:
- Broader Market Sentiment: The overall cryptocurrency market sentiment plays a significant role. Positive trends in Bitcoin and Ethereum often lift altcoins like INJ.
- Injective Ecosystem Developments: Keep an eye on developments within the Injective ecosystem, such as new partnerships, protocol upgrades, and adoption rates of its DeFi applications.
- Technical Analysis: Traders often use technical analysis tools and indicators to identify potential entry and exit points and assess the sustainability of price trends.
- Risk Management: Always practice prudent risk management. Never invest more than you can afford to lose, and diversify your portfolio.
In Conclusion: Injective’s Impressive Climb
Injective (INJ) is showcasing strong bullish momentum with a significant price surge, increased trading volume, and growing market capitalization. While the current performance is exciting, remember that the crypto market is dynamic and subject to change. Staying informed, conducting thorough research, and understanding your risk tolerance are key to navigating this exciting space.
Disclaimer: The information provided is not trading advice. Bitcoinworld.co.in holds no liability for any investments made based on the information provided on this page. We strongly recommend independent research and/or consultation with a qualified professional before making any investment decisions.
Disclaimer: The information provided is not trading advice, Bitcoinworld.co.in holds no liability for any investments made based on the information provided on this page. We strongly recommend independent research and/or consultation with a qualified professional before making any investment decisions.