
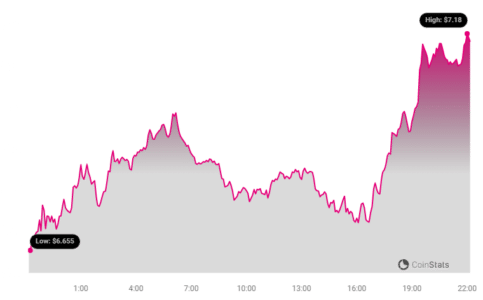
Cryptocurrency enthusiasts, buckle up! Polkadot (DOT) is making waves in the market again. Over the past 24 hours, the price of Polkadot (DOT) has experienced a significant surge, jumping by a notable 7.43% to reach $7.1. This upward momentum isn’t just a fleeting blip; it’s part of a larger positive trend that has seen DOT gain 8.0% over the last week, climbing from $6.47 to its current valuation.
But what does this price surge mean for investors and the broader crypto landscape? Let’s dive into the details and analyze what’s driving Polkadot’s recent bullish run.
Polkadot’s Price Performance: A Closer Look
To truly understand the significance of this price movement, let’s break down the key aspects:
- Impressive Daily Gain: A 7.43% increase in 24 hours is a substantial move in the crypto market, indicating strong buying pressure and positive sentiment around Polkadot.
- Sustained Weekly Growth: The 8% gain over the past week confirms that this isn’t just a short-term pump. DOT is demonstrating consistent upward momentum, suggesting a potentially more sustainable trend.
- Distance from All-Time High: While currently trading at $7.1, it’s important to remember that Polkadot reached an all-time high of $54.98. This highlights the significant growth potential that DOT still holds and the room for further appreciation.
See Also: One Crypto Trader Made $1.6 Million as New Solana Meme Coin, WEN, Soars 500%
Decoding Volatility: What Do the Charts Tell Us?
Analyzing price charts and volatility indicators is crucial for understanding the risk and potential reward associated with any cryptocurrency. Let’s examine the provided charts to gain deeper insights into Polkadot’s recent behavior.
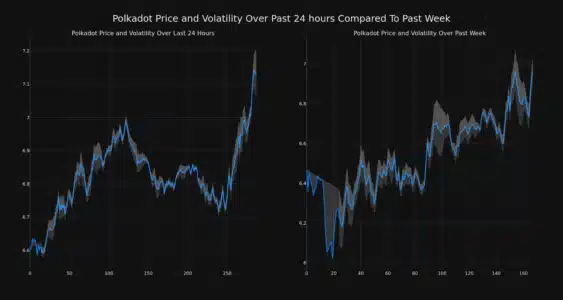
The chart above compares Polkadot’s price movement and volatility over two different timeframes:
- 24-Hour Price Movement (Left Chart): This chart gives us a snapshot of the immediate price fluctuations and volatility DOT has experienced in the last day.
- Weekly Price Movement (Right Chart): This provides a broader perspective, showing the price trend and volatility over the past week.
Understanding Bollinger Bands: The gray bands you see in these charts are called Bollinger Bands. They are a popular technical analysis tool used to measure volatility. Think of them as dynamic price ranges.
- Wider Bands = Higher Volatility: When the bands widen, it indicates that the price of DOT is experiencing significant fluctuations, meaning higher volatility.
- Narrower Bands = Lower Volatility: Conversely, narrower bands suggest lower volatility and more stable price movement.
By observing the Bollinger Bands, we can gauge the level of risk associated with trading DOT at different times. Periods of high volatility can present both opportunities for profit and risks of losses.
Beyond Price: Exploring Trading Volume and Circulating Supply
Price is just one piece of the puzzle. To get a holistic view of Polkadot’s market health, we need to consider other key metrics like trading volume and circulating supply.
Let’s break down what these metrics reveal:
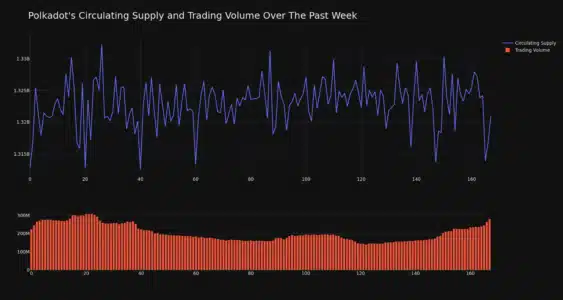
- Trading Volume Surge: A 25.0% increase in trading volume over the past week is a very positive sign. It indicates growing interest and activity in the Polkadot market. Higher trading volume often accompanies significant price movements and can suggest stronger market conviction.
- Circulating Supply Increase: The circulating supply of DOT has slightly increased by 0.63% to over 1.32 billion. A gradual increase in circulating supply is typical in many cryptocurrencies and can be due to staking rewards or token release schedules. It’s important to monitor the circulating supply as it can influence the token’s price dynamics.
Polkadot’s Market Position: Ranked #13
Currently, Polkadot holds the #13 rank in the cryptocurrency market capitalization rankings, with a market cap of $9.44 billion. This ranking underscores Polkadot’s position as a significant player in the crypto space. A strong market cap reflects investor confidence and the overall value attributed to the Polkadot network.
What’s Next for Polkadot?
Polkadot’s recent price surge and positive market indicators are encouraging signs. But what could be driving this momentum? Several factors could be at play:
- Broader Market Recovery: The overall cryptocurrency market has shown signs of recovery recently, and Polkadot is likely benefiting from this general positive sentiment.
- Polkadot Network Developments: Ongoing developments and upgrades within the Polkadot ecosystem, such as parachain auctions, new partnerships, and technological advancements, can boost investor confidence and drive demand for DOT.
- Increased Adoption and Use Cases: As more projects and applications are built on the Polkadot network, the utility and demand for DOT are likely to increase, potentially leading to further price appreciation.
In Conclusion: Is Polkadot a Crypto to Watch?
Polkadot’s recent price action and positive market indicators suggest a bullish outlook for the cryptocurrency. The 7% daily and 8% weekly gains, coupled with increased trading volume and a strong market cap ranking, paint a picture of growing momentum. While the crypto market is inherently volatile and past performance is not indicative of future results, Polkadot’s current trajectory and ongoing development make it a cryptocurrency worth keeping a close eye on.
Disclaimer: This article is for informational purposes only and should not be considered financial advice. Cryptocurrency investments are highly risky, and you should always conduct your own research and consult with a financial advisor before making any investment decisions.
Disclaimer: The information provided is not trading advice, Bitcoinworld.co.in holds no liability for any investments made based on the information provided on this page. We strongly recommend independent research and/or consultation with a qualified professional before making any investment decisions.